The views expressed are the authors’ personal opinions and do not necessarily reflect the views of the Deutsche Bundesbank or the Eurosystem. This policy brief is based on ECB Working Paper No 2773.
Abstract
Changes in product quality have a significant on impact inflation, yet their precise quantification is often unclear. In the euro area, the measurement of product quality is further complicated by the fact that national statistical institutes use different adjustment methods for various product groups. Using product-level scanner data, we estimate that this lack of harmonised quality adjustment practices causes an upward bias in inflation of around 0.3 percentage points in the five largest euro area countries. Furthermore, country inflation differentials are overestimated by around 0.5 percentage points. Our findings emphasise the need for greater harmonisation and transparency when measuring product quality for euro area inflation.
Measurement of consumer price inflation hinges not only on tracking raw price changes but also on isolating “pure” price movements from changes in product quality and quantity. In the euro area, national statistical institutes apply a variety of quality‐adjustment (QA) methods–ranging from explicit hedonic imputations to implicit overlap techniques–without binding harmonisation rules. This heterogeneity risks overstating or understating headline inflation and, importantly, may distort cross-country inflation differentials for otherwise homogeneous goods. In our study (Menz, Wieland, and Beck, 2025), we show that, for a selection of 15 products, a significant part in reported price differentials might reflect the underlying quality adjustment method rather than actual price trends. Using scanner data for consumer and household electronics in the five largest euro area countries, our results show that cross-country inflation differentials may be overestimated, with the level of inflation potentially being biased upwards as well.
Already in the early days of monetary union, Ahnert and Kenny (2004) point to differences in price trends in the HICPs for PCs and clothing. Similarly, Byrne (2019) shows that there are substantial differences in the price trends of the HICP for mobile phones in the EU. Chart 1 shows price trends in euro area countries for mobile phones from January 2016 onwards. The cumulative price change of mobile phones in the HICP since 2016 ranges from +2% in Portugal to -60% in Estonia. Given the homogeneity and tradability of this item, such large price differentials are surprising; one possible explanation for diverging price trends – especially for industrial products with continuous technological improvements – could be heterogeneous QA practices across euro area member states. Likewise, a case study of Austrian and Italian Consumer Price Index (CPI) micro data by Conflitti et al. (2022) suggests that the choice of QA methods can well explain the divergent HICP rates in the two countries.
Chart 1. HICP for mobile phones
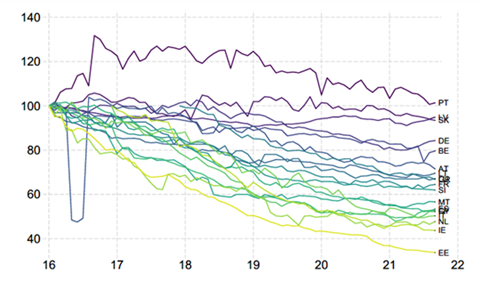
Note: The figure shows the HICP index “08202 Mobile phones without contract” indexed to January 2016=100 between January 2016 and September 2021. Data for Ireland and Finland start in December 2016 and for Greece in December 2017.
In the euro area, national statistical institutes are free to choose from various quality adjustment methods and decide which products these are applied to. The lack of binding rules can amplify inflation differentials, as also stressed by ECB (2021). We take a step forward in quantifying this measurement error by using harmonised micro-level transaction data from GfK’s point-of-sales retailer panel. Our data covers 15 product categories, mainly related to consumer and household electronics which are generally subject to quality adjustment. Our database covers five major euro area countries (Germany, France, Italy, Spain and the Netherlands) from January 2017 to May 2021. The data contains information on prices, product features, and total expenditure, which we use to conduct our own quality adjustment. We estimate Time-Product-Dummy (TPD) regressions, a multilateral method that is widely used to construct price indices from scanner data (Eurostat, 2022).
Chart 2 shows the resulting price indices based on scanner data and the harmonised quality adjustment approach and compares them with the official HICP for mobile phones in the five euro area countries. Two striking results emerge: First, our price indices are much more homogeneous across countries. Second, the downward price adjustment due to improvements in mobile phones is much stronger. These results also apply to other products in our sample, such as personal computers, and remain robust when hedonic regressions are used instead of the TPD approach.
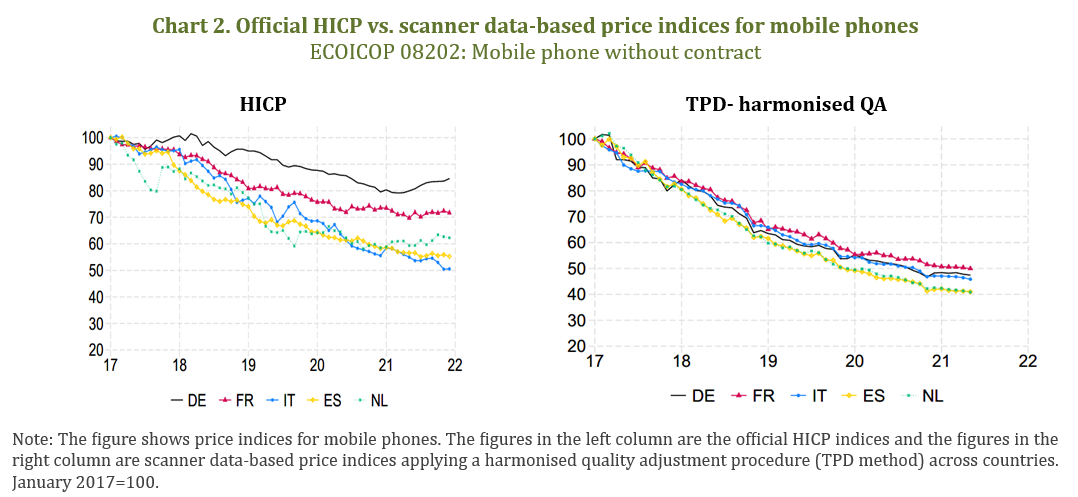
Overall, using the same database and quality adjustment approach, we find that the range of cross-country inflation rates for the available product categories is reduced from around 10pp. to around 4 pp. Multiplying this by the corresponding HICP weight of 1.5%, we find that the range of headline inflation rates between countries is reduced by 0.1pp. However, our scanner dataset lacks many products affected by quality changes, such as pharmaceuticals, medical products, cars, bicycles, and consumer durables. Assuming that a similar bias also applies to these products, the difference in headline inflation between the five countries would be reduced by 0.5pp. Similarly, our quality-adjusted inflation rate based on scanner data is about 3.5pp. lower than the official inflation rate for the same product groups. Multiplying this by the corresponding HICP weight leads to a measurement bias of +0.3pp. for euro area headline inflation, again assuming that quality-adjusted products for which we do not have scanner data are affected similarly.
Finally, German CPI micro data allows to shed more light on the impact of quality adjustment on the national inflation rate (see also Gautier et al., 2024, for an application of this data in the context of euro area price rigidities). Using product-level data underlying the German CPI, covering 85% of the overall HICP, we find that price adjustments due to quality changes have lowered the headline inflation rate by about 0.06pp. between 2015 and 2020, which was offset by a price increase caused by quantity adjustments of around the same magnitude (e.g., smaller package sizes). However, the overall impact of quality adjustment on German headline inflation is certainly larger, also because the German dataset excludes some electronic goods that are typically adjusted for quality changes. Using scanner data, which mainly include goods that are subject to quality adjustment and which we lack in the German CPI micro data, the estimated impact of quality adjustment on price changes for these goods is 3.7pp. Adding this to the results from the CPI micro price data gives an estimate of 0.6pp. for overall inflation in Germany, which is quite close to earlier findings in the literature (Hoffmann, 1998).
Our findings carry important implications for monetary policy and statistical measurement. Our estimate of the impact of heterogeneous QA procedures on euro area inflation is similar in magnitude to the measurement bias in the HICP due to substitution effects or the absence of owner-occupied housing (ECB, 2021). Since this bias is not constant over time, it poses a double problem for policymakers: not only does it lead to an overestimation of euro area inflation, but it also contributes to larger inflation differentials between countries. This creates difficulties in terms of communication, but also in terms of measuring the stance of monetary policy.
Moreover, our study highlights the importance of methodological transparency and harmonisation across national statistical institutes with respect to quality adjustment. While the European statistical framework mandates certain quality-adjustment procedures, implementation differs across countries and product categories. We argue for a greater standardisation in the use of hedonic techniques and the inclusion of richer microdata to improve cross-country comparability and measurement consistency. We also suggest that statistical agencies publish regular evaluations of the effects of their quality adjustment on headline inflation.
Ahnert, H. and G. Kenny (2004). Quality Adjustment of European Price Statistics and the Role for Hedonics. ECB Occasional Paper, No 15.
Byrne, D. M. (2019). The Mysterious Cross-Country Dispersion in Mobile Phone Price Trends. National Institute Economic Review, 249(1):R39-R46.
Conflitti, C., B. Goldhammer, M. Maier and F. Rumler (2022). Is there a Measurement Bias from Quality Adjustment in Austria and Italy? Ottawa Group, Rome, June 2022.\\[.25cm]
ECB (2021). Inflation Measurement and its Assessment in the ECB’s Monetary Policy Strategy. ECB Occasional Paper, No 265.
Eurostat (2022). Guide on Multilateral Methods in the Harmonised Index on Consumer Prices. Eurostat Manual and Guidelines.
Hoffmann, J. (1998). Problems of Inflation Measurement in Germany. Deutsche Bundesbank Discussion Paper No. 1/98.
Menz, J.-O., E. Wieland and G. Beck (2025). Estimating the Impact of Quality Adjustment on Consumer Price Inflation. ECB Working Paper, No 2773 and International Journal of Central Banking, forthcoming.