This Policy Brief is based on De Nederlandsche Bank Working Paper No. 793. Views expressed are those of the authors and do not necessarily reflect official positions of De Nederlandsche Bank.
Monetary policy faces fundamental uncertainty about the shocks that drive inflation. We rationalize this by the inability of the central bank to observe the output gap. By a novel empirical method, applicable to linearized DSGE models, we generate shock combinations that may drive inflation and infer distributions of potential welfare losses. Analyzing the 2022 inflation surge in the US, the method helps to identify a potential tail risk related to a situation where inflation is driven predominantly by supply shocks. From this we conclude that robust monetary policy follows a balanced approach, reacting not overly strong to inflation, to limit adverse welfare losses.
The recent series of demand and supply shocks hitting the global economy created large uncertainty about the inflation outlook. The economy faced a mixture of negative supply shocks – like the pandemic and the surge in energy prices – and positive demand shocks, driven by fiscal spending and pent-up consumer demand. These resulted in soaring inflation. As a consequence, policymakers at both sides of the Atlantic have acknowledged the large uncertainties about the economic outlook, as well as the need to follow a risk management approach to avoid costly mistakes (Powell 2023).
In a similar vein, Schnabel (2023) emphasized the risk of policy mistakes that can arise from depending too strongly on economic projections and model outcomes. For instance, output gap estimates have been criticized both from an academic and policy perspective. A large strain of literature, starting with Orphanides and van Morden (2002), emphasizes the low reliability of these estimates, due to large data revisions, especially after crisis episodes. Furthermore, there exist large discrepancies between estimates by different institutions of the output gap, due to methodological differences, which for the US economy in 2023 range from +1% (IMF), 0% (OECD) to -2.6% (CBO).
The unprecedented fluctuations in the economy have made projections of inflation and output highly uncertain, also because model relations based on past regularities broke down. In Carceller and van den End (2023) we emphasise that if it is not possible to observe (or reliably estimate) the output gap, it is not possible to identify the true combination of shocks that drives observed inflation. Thus, monetary policymakers suffer from missing information, which we call shock uncertainty. This raises the question which monetary policy response can limit adverse tail outcomes under those conditions, while achieving an inflation rate sufficiently close to target. In other words which monetary policy is robust to shock uncertainty.
To address this question we propose a new empirical method that allows the central bank to guess the drivers of observed inflation without information about the output gap, while the distribution of shocks is unknown. Under these conditions, we generate combinations of supply and demand shocks that may drive the observed high inflation, while being agnostic about the relative contribution of the shocks to inflation. The shock combinations represent the central bank‘s ‘informed guess’ of the inflation narrative and this guess is shaped by the structure of the economy. We apply the empirical method to the Dynamic General Equilibrium (DSGE) model of Smets and Wouters (2007), calibrated to match the most recent US inflation peak. This allows us to infer conclusions for robust monetary policy under fundamental uncertainty regarding the shock drivers of inflation. By using this novel empirical approach we contribute to the literature on shock uncertainty, see for instance Giannoni (2007), Grassi et al. (2016) or Bloom (2009).
To conduct monetary policy under fundamental uncertainty, the central bank uses its knowledge about the structure of the economy to understand the contribution of supply and demand shocks to observed inflation. The relationship between the shocks, which we label as the shock marginal rate of substitution (SMRS), can be derived from the parameters of the structural economic model used by the central bank. The SMRS determines by how much the contribution of the demand shock has to increase for a marginal decrease of the supply shock, so that the combination of both shocks explains the observed inflation (and vice versa). The unobserved output gap takes a different value for each shock combination.
To generate the central bank’s guess of the drivers of inflation, our method includes a Monte Carlo experiment (based on the algorithm of Sims and Zha, 2012), in which each simulation randomizes a measure of the relative importance of each shock. The random draws are taken from a uniform distribution, implying that the underlying joint distribution of shock combinations is unknown. For a large enough number of draws we can map the complete set of possible shock combinations and their probabilities. Each shock combination found in this exercise: (i) explains observed inflation, (ii) implies an output gap that can either be positive or negative, depending on the relative strength of the supply shock, and (iii) can be used to simulate the evolution of the economy conditional on this new information. Based on the shock combinations we then run a welfare analysis.
We apply the empirical method to understand the potential drivers of the recent inflation surge in the workhorse monetary policy model of Smets and Wouters (SW, 2007), estimated for the US. Figure 1 plots the full range of potential shock drivers of the observed peak in US inflation in 2022Q2. It shows that it is likely that inflation is explained by an even mixture of supply and demand shocks (most mass of the red dots on the downward sloping line in the top right panel is centred around the blue dot). The low concentration at the right end of this line rules out the possibility that inflation is explained solely by demand shocks (i.e. we do not expect the output gap to be positive). Furthermore, the distribution of supply shocks has a fat right tail, as reflected in the mass at the right end of the top left panel. This indicates that there exists a non-negligible tail probability that inflation is largely driven by a supply shock.
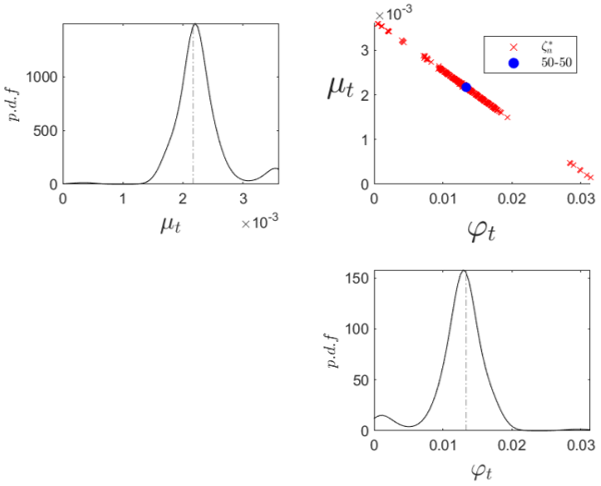
Note: Each red x represents a shock combination derived from our empirical method based on the SW model, while the blue dot is the point in which inflation is equally driven by supply (µ) and demand (φ) shocks, which is also reflected in the dotted vertical lines in the left and lower panels. The top left and bottom panels represent the densities of the shock combinations collapsed to one of the dimensions of the middle panel.
The distributions of welfare losses, following from the simulations of the US economy with the SW model, show that for the largest mass of shock combinations the losses are relatively contained (Figure 2). However, there is bimodality in the distribution of supply shock dominated scenarios. These states likely generate lower welfare losses than demand dominated ones, although the supply loss distribution has a small fat tail at the right, which is associated with a large welfare cost. This tail corresponds to the shock combinations that are explained almost entirely by the supply shock (reflecting the right tail of the distribution in the upper left panel of Figure 1).
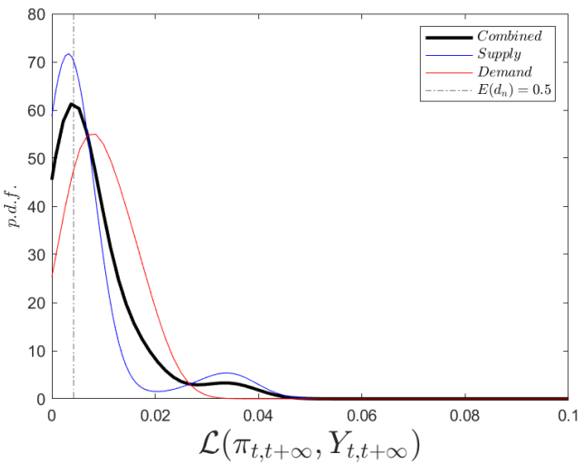
Note: The solid black line represents the density function of the loss distribution generated by all shock combinations. The blue (red) line shows that same density, considering only supply (demand) driven scenarios, meaning those combinations at the left (right) of the blue dot in Figure 1. The dotted line represents the realized loss (ℒ) under the expected scenario (blue dot in Figure 1).
To assess the central bank’s response to inflation, we conduct counterfactual exercises of policy rate responses to inflation, based on the central bank’s guess of the shock scenarios. We consider three monetary policy responses based on the Taylor rule: a moderate response to inflation, a strong and a very strong response. The exercise distinguishes the full sample of shock combinations (represented in Figure 3 by the median (expected) outcomes of inflation and the output gap, ie the solid lines) and those that are heavily driven by supply shocks (reflecting the tail outcomes, ie the dotted lines).
Figure 3 (left panel) shows that inflation drops when the policy rate response is stronger, both in case of the expected outcomes and the tail outcomes. The desired effect of a stronger response to inflation holds for the output gap as well, but only in case of the expected outcome (solid lines in right panel): the negative output gap then closes quicker. It suggests that taking into account the full set of shock combinations – as reflected in the expected outcomes for inflation and the output gap – reacting stronger to inflation improves welfare. The reason is that a stronger policy rate response helps to bring down inflation faster, and the output gap converges more closely to the steady state. However, in case of the supply driven tail outcomes (dotted lines) the output gap is deeply negative on impact. Reacting more strongly to inflation then leads to an even more negative output gap in the near term.
Inflation reaches the target sooner in case of tail outcomes (dotted lines) than in case of the expected outcomes (solid lines). This is explained by the dampening effect of the negative output gap on inflation. The output gap declines further, starting from a value that is already more negative that initially expected according to the median outcome. In this case, increasing the response to inflation leads to a deeper and more painful recession than in the initial state. It shows that an overly strong response to inflation is hazardous if a supply tail state of the world would materialize. Such a response to inflation reduces welfare. From this we conclude that an aggressive response to inflation is not robust optimal to shock uncertainty.

Note: The solid lines represent the simulated paths of inflation (left panel) and the output gap (right panel) under a moderate (black), strong (blue) or very strong (red) response of the central bank to inflation, considering all possible scenarios. The policy response follows the Taylor rule, with reaction parameter of inflation ϕπ. Dotted lines only consider the tail outcomes driven by supply dominated shock scenarios.
In conclusion, our analysis indicates that there is a high probability that the shock combination that drove the recent US inflation peak was roughly equally driven by supply and demand shocks. However, taking into account shock uncertainty, ex-ante we identify a tail probability that inflation was almost entirely driven by supply factors. In that case, a strong central bank response to inflation would generate large losses. From this we conclude that limiting tail losses under uncertainty calls for a moderate monetary policy response, following Brainard’s attenuation principle. Such a risk management approach mitigates the potential tail risks related to supply shocks, in a state of fundamental uncertainty about the shock drivers of inflation.
Bloom, N. (2009), The Impact of Uncertainty Shocks, Econometrica, 77, 623-685.
Carceller del Arco, M. and J. W. van den End (2023), Robust monetary policy under shock uncertainty, DNB working papers, 793.
Giannoni, M.P. (2007), Robust Optimal Monetary Policy in a Forward-Looking Model with Parameter and Shock Uncertainty, Journal of Applied Econometrics, 22(1), 179-213.
Grassi, S., M. Leon-Ledesma and F. Ferroni (2016), Fundamental shock selection in DSGE models, Meeting Papers 47, Society for Economic Dynamics.
Orphanides, A. and S. van Norden (2002), The Unreliability of Output-Gap Estimates in Real Time, The Review of Economics and Statistics, 84(4), 569–583.
Powell, J. H. (2023), Inflation: Progress and the Path Ahead. Speech at “Structural Shifts in the Global Economy,” an economic policy symposium sponsored by the Federal Reserve Bank of Kansas City, Jackson Hole, Wyoming, Aug. 25th.
Schnabel, I. (2023), The risks of stubborn inflation. Speech at the Euro50 Group conference on “New challenges for the Economic and Monetary Union in the post-crisis environment”, Luxemburg, Jun. 19th.
Sims, C.A. and T. Zha (2012), Matlab manual.
Smets F. and R. Wouters (2007), Shocks and Frictions in U.S. Business Cycles: A Bayesian DSGE Approach, American Economic Review, American Economic Association, 97(3), 586-606.