

All opinions expressed here in this policy brief are our own and do not necessarily reflect those of Bank of Finland or the Eurosystem.
Abstract
This paper examines government revenue sources through the lens of fiscal illusion. A significant finding is that a substantial gap exists between tax revenues and total expenditure, with only a small portion financed by borrowing. The so-called “other revenue” category includes sources that, while economically significant, do not always constitute true revenue under the government’s intertemporal budget constraint. These components may distort perceptions of the current fiscal stance and burden.
Fiscal illusion theory posits that taxpayers and citizens systematically misperceive the true costs and benefits of government spending, taxation, and public services due to the complexity, opacity, or structure of fiscal systems. This misperception can lead to inefficient public policy decisions, such as excessive government spending or misaligned tax preferences, as individuals fail to fully understand fiscal trade-offs. Often associated with economists like James Buchanan and the public choice school, the theory suggests governments may exploit these misperceptions to expand budgets or influence voter behaviour (cf. Puviani, 1976).
Key aspects of fiscal illusion include: (a) Complexity of Tax Systems: Complex or indirect taxes (e.g., payroll taxes, hidden fees) obscure the true cost of government, making it harder for citizens to link taxes paid to services received. (b) Debt Financing: Borrowing to fund current spending creates an illusion of lower costs, deferring tax burdens to future generations. (c) Revenue Diversification: Governments using multiple revenue sources (e.g., taxes, fees, grants) can mask the total fiscal burden. (d) Asymmetric Information: Citizens often lack complete information about government budgets, leading to biased perceptions of efficiency or necessity. In addition to standard budgetary processes, many countries impose supplementary budgets, expenses, or taxes during the fiscal year. This issue is particularly acute in countries with multiple layers of governance, each collecting revenues.
The complexity of tax systems often manifests in “hidden taxes,” which are indirect or embedded costs within goods, services, or infrastructure not explicitly labelled as taxes but functioning as such, affecting consumers and businesses. These include regulatory fees, compliance costs, or economic externalities embedded in pricing structures for services like water, electricity, parking, or utilities. It should be emphasized that these costs need not be pecuniary and may include non-monetary externalities.
A significant source of complexity arises from governments’ business activities, particularly state-owned enterprises (SOEs). Nearly all European countries operate various types of SOEs at different governmental levels. There are substantial differences in how these firms interact with government budgets (e.g., the extent to which they contribute funds or receive subsidies). This variability complicates reliable cross-country comparisons, which are commonplace in the European Union (cf. OECD, 2024; De Lange & Merlevede, 2020). Beyond business firms, the “third sector” of non-profit institutions often operates closely with governments, receiving significant revenue through grants while providing services that may resemble public sector outputs. In national accounts, these entities are typically classified under the household sector, but it is unclear whether this classification is appropriate.
Government ownership would not create a problem unless there are changes in this ownership. Recently the changes have been mostly sales. These sales are typically recorded at nominal transaction prices, without accounting for the present value of the future income streams that the assets would have generated. A proper intertemporal assessment would require discounting these future flows, highlighting the fiscal cost of reduced public wealth. This mismeasurement can create a significant fiscal illusion by overstating revenues.
The existence of fiscal illusion is not merely as an academic curiosity; it can lead voters to support policies that are fiscally irresponsible or appear beneficial in the short term but incur significant long-term costs. Conversely, public scepticism toward government estimates and projections may mitigate these effects (Parleviet et al., 2021; Tyran & Sausgruber, 2005).
This study does not estimate the size of hidden taxes or their total fiscal impact. Instead, it aims to present stylized facts about the magnitude of the “grey area” between conventionally defined tax revenues and total expenditures across EU countries. Both time-series and cross-sectional evidence will be examined.
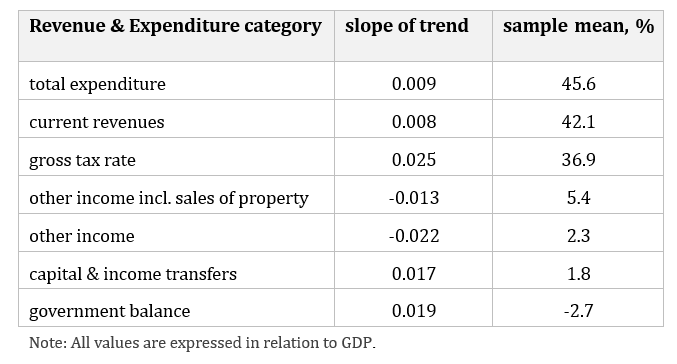
One indicator highlighting the importance of fiscal illusion is the gap between tax revenues and total expenditure (henceforth the “revenue gap”). Figure 1 presents the mean value of this indicator for all EU countries. Figure 2, these time-series data are compared with conventional general government net lending data. A worsening trend appears evident from the 1970s to the 1990s. While this may partly reflect EU expansion, closer examination of individual countries suggests this is not the primary driver of the trend. After that, mid-1990s, some levelling off takes place, which shows up in the slopes of time trends for main revenue categories of general government (Table 1).
Figure 1. Difference between tax returns and total expenditure of general government/GDP, %
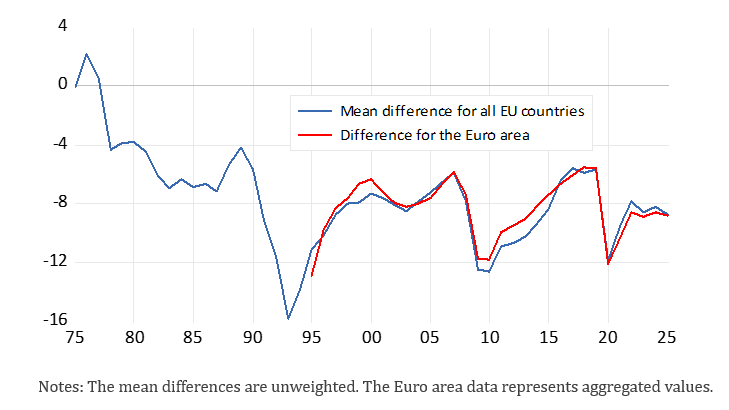
Figure 2. Comparison between the “revenue gap” and net lending
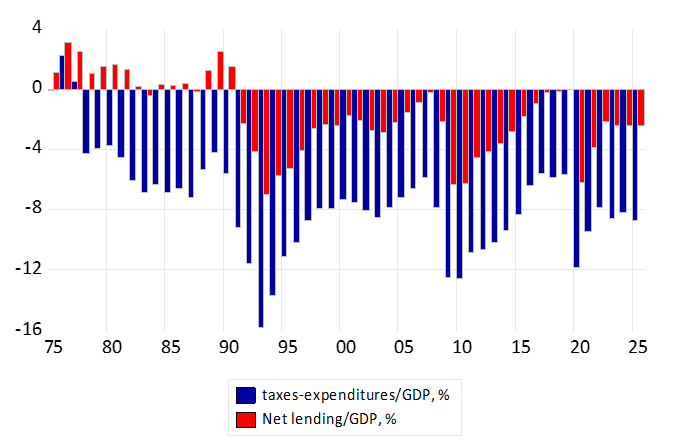
Table 1. Trend of revenue categories for the 1995-2024 period
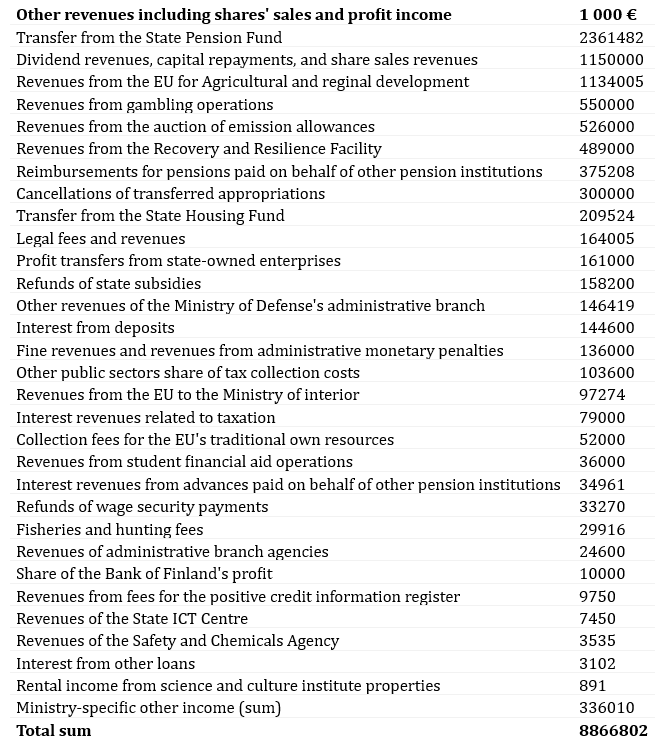
Disaggregating the revenue gap is desirable but challenging. It can be divided into “other income,” “income from property and asset sales,” and income transfers, primarily from the EU. Corresponding data for the EU and individual countries are presented in Figures 3 and 4. At the country level, a more detailed classification is possible; for example, Finland’s Appendix illustrates the complexity of the other revenue component, including how asset sales and government fund transfers are classified as revenue.
Figure 3. Comparison of the other income components

Figure 4. Comparison of country values of other incomes
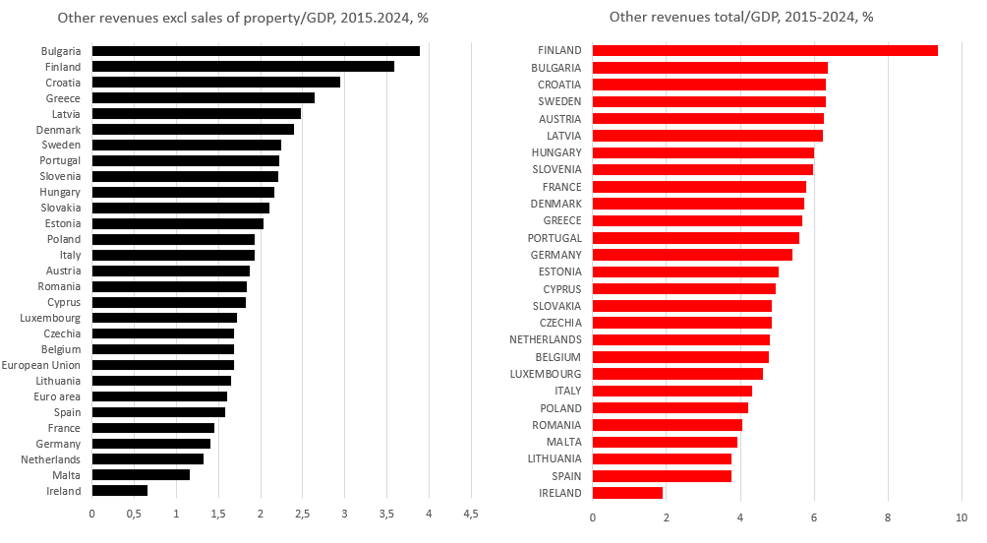
The GDP ratios of revenue components have remained largely stable over the past 30 years, though significant variations exist across countries. These differences largely reflect the size of the state-owned enterprise sector (De Lange & Merlevede, 2020). Despite privatization efforts in many countries, the share of other income components has not declined significantly, possibly due to revenues from property and asset sales offsetting reductions. However, low inflation throughout most of the 2000s reduced seigniorage income from central banks. Table 1 indicates a declining trend in other income components, which may partially explain why many governments have recently struggled to balance expenditures and revenue. The only category showing a clear trend is transfers, though their average magnitude remains low, currently around 2% of GDP (Figure 5).
Figure 5. Public investment and transfers/GDP, %
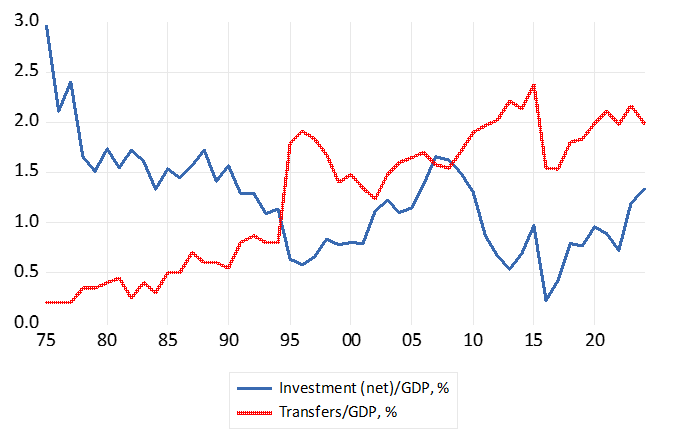
From the perspective of the intertemporal budget constraint, the financing of investments is also significant. For instance, if net investment is negative, government wealth declines, even though this may not appear in financial accounts. Figure 5 suggests that there has indeed been a declining trend in both gross and net investment (except for 2023 and 2024). In 2016, the mean level of net investment rate was close to zero. In fact, negative net investment values were detected in 16 (out of 27) countries for the whole sample period. Additional challenges arise from new financing methods, such as leasing systems and public-private partnerships. Although statistical regulations govern these methods, governments can still retain the ability to manipulate outcomes.
The tax burden is evident to most voters, but other income components are less noticeable, often perceived as mere “costs” rather than taxes. Greater concerns arise from items that do not constitute revenues under an intertemporal budget constraint, such as proceeds from government asset sales. More problematic are intra-governmental income transfers, such as transfers of funds between government entities (e.g., reallocations from government funds). Although the European Commission and the Stability and Growth Pact (SGP) aim to ensure fiscal discipline, national governments frequently employ various manoeuvres to circumvent these rules. From the perspective of trust in democratic institutions and economic policy frameworks, these tendencies are clearly detrimental.
Example of classification of Finnish central government 2025 budget income
De Lange, B. and B. Merlevede (2020), State-Owned Enterprises across Europe: Stylized Facts from a Large Firm-level Dataset. Chent University Working paper 1006. https://www.researchgate.net/publication/344833099_State-Owned_Enterprises_Across_Europe_Stylized_Facts_from_a_Large_Firm-Level_Dataset#fullTextFileContent.
OECD (2024), Ownership and governance of state-owned enterprises. OECD Paris. https://www.oecd.org/en/publications/ownership-and-governance-of-state-owned-enterprises-2024_395c9956-en.html
Parleviet, J., M. Giuliodori and M. Rooduijn (2021), Populist attitudes, fiscal illusion and fiscal preferences: evidence from Dutch households. DNB Working Paper 731. https://www.dnb.nl/media/uwkldwa4/working_paper_no-_731.pdf
Puviani, A. (1976),Teoria della illusione finanziaria. first published 1903. Milano, ISEDI, 1976.
Tyran, J.-R. and R. Sausgruber (2005), Testing the Mill Hypothesis of Fiscal Illusion, Public Choice 122(1), 39-68. https://www.researchgate.net/publication/5154403_Testing_the_Mill_Hypothesis_of_Fiscal_Illusion