Disclaimer: This Policy Brief is based on Banka Slovenije Short economic and financial analyses, Measures of inflation sensitivity to monetary policy. The views expressed in this paper are solely the responsibility of the author and do not necessarily reflect the views of the Bank of Slovenia or the Eurosystem.
Abstract
This analysis examines the sensitivity of core inflation components to monetary policy shocks in the euro area. Using a granular inflation dataset, the analysis employs a local projection model to estimate impulse response functions for individual inflation components. The results reveal significant heterogeneity in inflation sensitivity, with some components experiencing a strong negative response to monetary tightening, while others exhibit negligible responses. By classifying inflation components into most sensitive and least sensitive categories, this study constructs new inflation measures to track their respective dynamics. The findings suggest that while monetary tightening substantially reduced the most sensitive inflation after the last hiking cycle, the least sensitive inflation demonstrated greater persistence. Furthermore, the findings suggest that external shocks, such as energy price fluctuations and supply chain disruptions, could have played a crucial role in driving the divergent inflationary trends observed after the pandemic across the new inflation measures.
Since the onset of the Covid-19 pandemic, inflation has become a central focus of economic discussions, as headline inflation in the euro area reached historically high levels. By 2022, headline inflation surged past 10%, driven by a combination of external shocks, including global supply chain disruptions, soaring energy prices following the war in Ukraine, and expansionary monetary and fiscal policies. In response to high inflation, the European Central Bank (ECB) implemented a substantial hiking cycle, increasing policy rates by 450 bps from July 2022 until September 2023. While considerable tightening of the monetary policy stance contributed to a moderation in headline inflation, core inflation, which excludes energy and food prices to minimize short-term volatility, remained persistently elevated.
Figure 1. Underlying inflation in the euro area
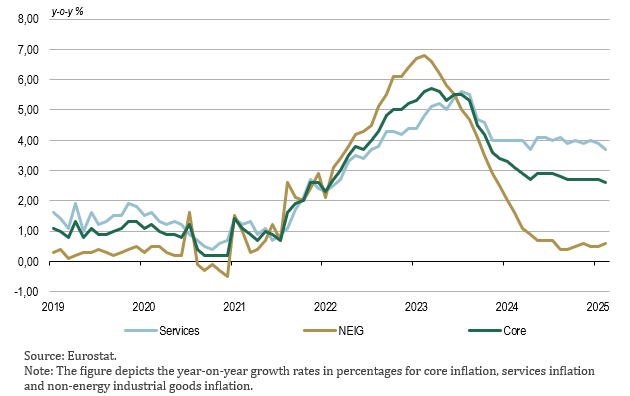
As shown in the Figure 1, core inflation rose sharply after 2021, increasing from approximately 1% to nearly 6% by March 2023. However, the trajectories of its underlying components varied significantly. While non-energy intensive goods (NEIG) inflation peaked in February 2023 before undergoing a notable decline, services inflation peaked in July 2023 and persisted at around 4% without dropping below 3.7%. This divergence highlighted that inflationary pressures were not uniform across price components, raising important questions about the transmission of monetary policy and why some price components exhibited greater sensitivity to policy changes than others.
To estimate the sensitivity of inflation components to monetary policy shocks a local projection model1 is employed using granular core inflation data, to eliminate the more volatile inflation components that are heavily influenced by external factors. Specifically, Eurostat’s level 4 classification is utilized, which breaks down core inflation into 72 distinct components. Prior to estimation, all components are seasonally adjusted. For identifying monetary policy shocks, the Jarocinski and Karadi (2020) monetary policy surprises are used. The model is estimated over the period from 2001 to 2019.
To identify the inflation components most and least sensitive to monetary policy, the largest cumulative decline in response to a monetary policy shock is extracted for each HICP component. These responses are then ranked by the size of their cumulative decline. The top and bottom 40th percentiles of components are selected and adjusted for their respective weights in the HICP basket, forming two distinct groups for further analysis.
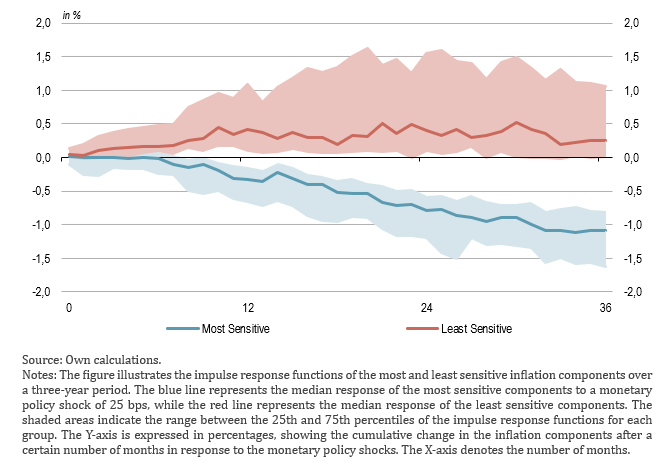
Figure 2 illustrates the impulse response functions of the most and least sensitive inflation groups, with the shaded areas representing the interquartile ranges and the solid lines denoting the median impulse response function for each group of inflation components. From the figure, it can be seen that there is a clear distinction between the most and least sensitive inflation. Over a three-year horizon, the median impulse response of the most sensitive components shows approximately a 1% decline in response to a tightening monetary policy shock. On the other hand, the median of the least sensitive components does not negatively respond to monetary policy, showing a 0.25% increase in response to the monetary policy shock, highlighting a clear heterogeneity in inflation components’ sensitivity to monetary policy.
Figure 2. Responses of most and least sensitive inflation components to MP shock
The heterogeneous effects of monetary policy on inflation components are further illustrated in Figure 3, which presents coefficient values and their significance, where insignificant coefficients are represented by grey cells. The figure confirms that the most sensitive group is negatively affected by a tightening monetary policy shock, while highlighting that among the most sensitive components, the majority exhibit statistically significant responses approximately one year after the shock. Some examples of highly responsive components include major durables for indoor and outdoor recreation, electrical appliances for personal care, and passenger transport by sea and in-land waterway. Furthermore, it can be observed that the most sensitive group comprises a larger number of components compared to the least sensitive group, as most sensitive components tend to have a lower weight in the HICP index relative to less sensitive ones.
Figure 3: Coefficient values of inflation components to monetary shocks over a three-year period
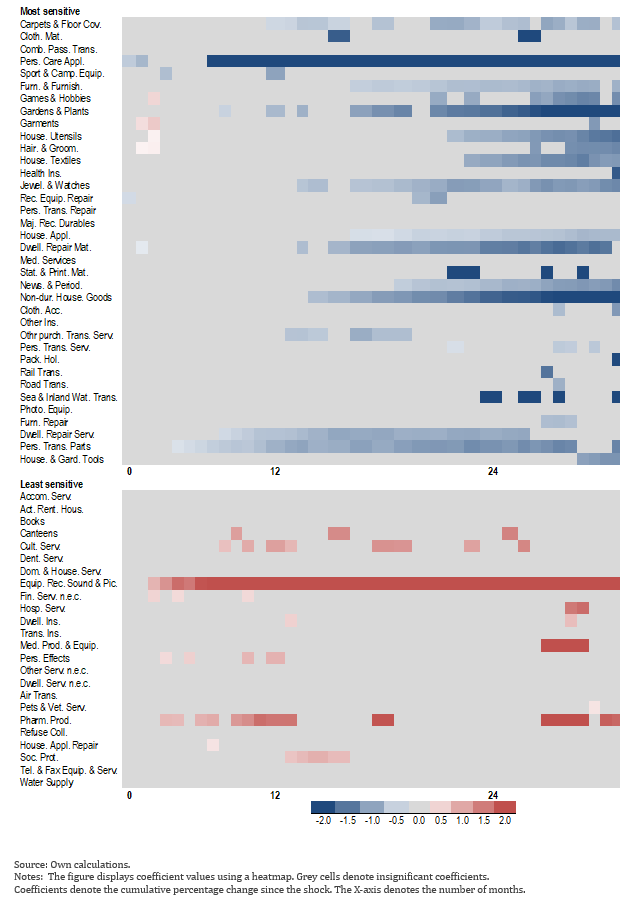
Figure 3 also shows the coefficients for the least sensitive components which display minimal responsiveness to monetary policy shocks. Some components’ coefficients show a temporary positive response within the first year but soon become insignificant. The least responsive components include other services in respect of personal transport equipment, major household appliances, and maintenance and repair of personal transport equipment.
Once the groups are identified, new HICP measures for the most and least sensitive inflation components are constructed. This is achieved by weighting the indices of individual components within each group according to the annually updated weights provided by Eurostat.
As illustrated in the Figure 4, the most sensitive measure is notably more volatile, with periods of pronounced divergence from the least sensitive measure. Such divergences occurred in 2006–2010, 2011–2013, and during a sharp rise in 2015. In the post-pandemic inflationary surge, the most sensitive measure rose rapidly from mid-2021, peaking at 6.7% in March 2023, while the least sensitive measure increased more gradually, reaching a lower peak of 4.7% in July 2023.
Figure 4. Measures of most and least sensitive inflation
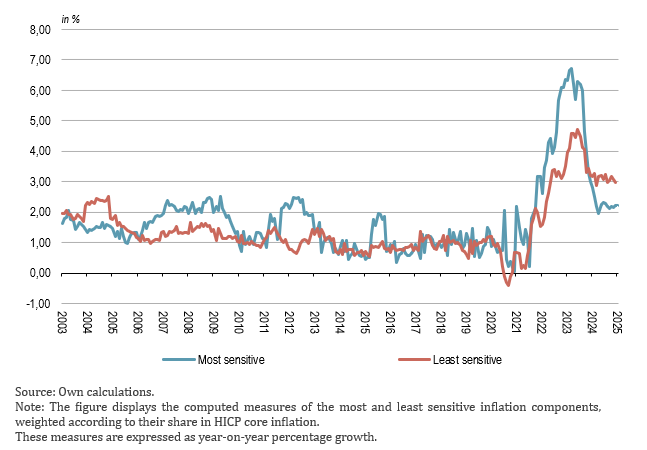
Following the implementation of the substantial hiking cycle in the euro area which started in mid-2022, where policy rates increased from -0.5% to a peak of 4%, both inflation measures began to decline. The most sensitive inflation responded quickly, falling close to target, whereas the least sensitive measure reacted with a lag, only returning to levels seen in August 2022 and remaining persistently above target at around 3%. This persistence has thus been a key driver of above-target core inflation in late 2024.
However, the question of why the most sensitive inflation increased significantly more than the least sensitive inflation after 2020 remains unresolved. A straightforward interpretation is that the loose monetary policy stance contributed to a disproportionate rise in the most sensitive inflation. Yet this explanation appears limited, as monetary policy had already been highly accommodative since 2015, with negative interest rates and the introduction of the Asset Purchase Programme (APP). An alternative interpretation is that the most sensitive inflation is also more responsive to exogenous shocks, such as energy price fluctuations, global supply chain disruptions and commodity price shocks.
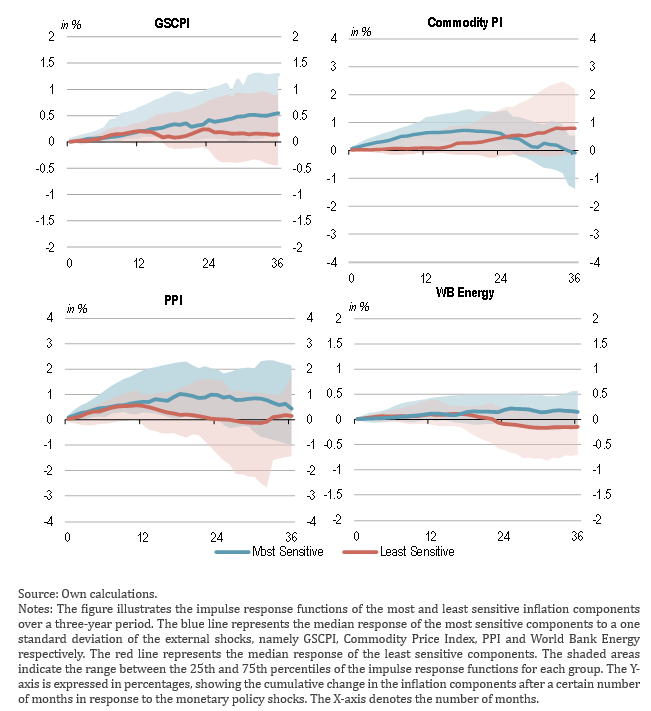
To test whether the most sensitive inflation is more sensitive to exogenous shocks, the same model as above is used, but with a different source of intervention. Instead of using monetary policy shocks, the following shock variables are used: the Global Supply Chain Pressure Index (GSCPI), the Commodity Price Index (Commodity PI), the Producer Price Index (PPI), and the World Bank Energy Price Index (WB Energy).
Figure 5 presents the median impulse response functions for each inflation group in response to the external shocks. It can be seen that in all cases a one-standard-deviation increase in an external shock leads to a rise in both inflation groups. However, the most sensitive inflation exhibits a stronger response compared to the least sensitive.
This suggests that the rise in most sensitive inflation components after 2020 may be partially driven by external shocks. These shocks became particularly substantial after the end of COVID-19 lockdowns, when growing demand and supply side constraints, such as supply chain bottlenecks (proxied by the Global Supply Chain Pressure Index), exerted upward pressure on prices. Additionally, energy prices surged, especially following the outbreak of the war in Ukraine, as reflected in the World Bank Energy Price Index. Other commodity prices also increased, which may have disproportionately affected the most sensitive components. This could thus explain the sharp and rapid rise in most sensitive inflation observed in 2022.
Figure 5. Measures of most and least sensitive inflation
Altavilla, C., Brugnolini, L., Gürkaynak, R. S., Motto, R., & Ragusa, G. (2019). Measuring Euro Area Monetary Policy. Journal of Monetary Economics, 108, 162–179.
Arnaut, Z., & Bengali, L. (2024). How Quickly Do Prices Respond to Monetary Policy? FRBSF Economic Letter, 2024, 10.
Jarociński, M., & Karadi, P. (April 2020). Deconstructing Monetary Policy Surprises – The Role of Information Shocks. American Economic Journal: Macroeconomics, 12, 1–43.
Jordà, Ò. (March 2005). Estimation and Inference of Impulse Responses by Local Projections. American Economic Review, 95, 161–182.
Motto, R., & Özen, K. (2022). Market-stabilization QE. Available at SSRN 4035082.
The methodology in this analysis draws on the approach outlined by Arnaut and Bengali (2024), who performed a similar analysis for US inflation components.