Disclaimer: The opinions in this Policy Brief are solely those of the authors and do not necessarily represent those of Banco de España or the Eurosystem.
This piece is based on Mercedes de Luis, Emilio Rodriguez and Diego Torres (2023). “https://www.bde.es/wbe/en/publicaciones/analisis-economico-investigacion/documentos-trabajo/machine-learning-applied-to-active-fixed-income-portfolio-management–a-lasso-logit-approach-.html” Banco de España Working Paper No. 2324.
This policy brief note is based on a working paper that investigates the performance of machine learning algorithms, particularly Lasso Logit Regression, in actively managed high-grade bond portfolios. It emphasizes the superior performance of ensemble algorithms and underscores the significance of the proposed signal translation approach. Notably, a noteworthy portion of alpha generation stems from the identification of ‘extreme’ movements, while it also highlights the presence of time-dependency and instability in selected financial and economic variables.
The use of quantitative methods constitutes a standard component of the institutional investors’ portfolio management toolkit. In the last decade, several empirical studies have employed probabilistic or classification models to predict stock market excess returns, model bond ratings and default probabilities, as well as to forecast yield curves. To the authors’ knowledge, little research exists into their application to active fixed-income management. This paper contributes to filling this gap by comparing a machine learning algorithm, the Lasso logit regression, with a passive (buy-and-hold) investment strategy in the construction of a duration management model for high-grade bond portfolios, specifically focusing on US treasury bonds.
The method proposed to overcome potential worse out-of-sample performance in Lasso logit algorithm consists of a two-step procedure. In the first step, a Lasso logit model is estimated with a long time span (ten years, in order to include around two economic cycles) that is interpreted as the long-term relationship between financial and economic variables and the portfolio performance. In the second step, another model is estimated, a simple logit regression with the error committed in t – 1 and the prediction made by the Lasso logit estimated with the long time span as explanatory variables, this step is estimated for the last four years (around a standard economic cycle). If the error committed in t-1 is statistically significant, the probability eventually used will be the one obtained in the second step; otherwise, it will be the one obtained in the first step.
A simple ensemble averaging is also proposed to overcome possible overfitting or model misspecification. Ensemble averaging is the process of creating multiple models and combining them to produce a desired output, as opposed to creating just one model. The ensemble of models frequently performs better than any individual model, because the various errors of the different models tend to “average out”. In the present study three distinct models are estimated, each pertaining to a specific type of statistical property observed in the data, namely level, first difference, and monthly growth stationary variables. The final estimation is obtained by taking a simple average of the three estimates.
Another contribution of the paper is an algorithm that translates probabilities into three portfolio duration signals (short, neutral and long). The algorithm checks the distribution of probabilities given by the model in the in-sample period conditioned on the observed direction of the portfolio market value (i.e. if it had positive or negative returns). Short signals are derived from probabilities lower than the 25th percentile of the distribution when the index went down and long signals when probabilities are higher than the 75th percentile, but in this case conditioned on cases where the index went up (Chart 1). Neutral signals are assigned to probabilities between those two previously defined thresholds (i. e. higher than the 25th percentile when the index presented negative returns and lower than the 75th percentile when positive returns were observed). The proposed mapping is also compared to a “naïve” threshold or “rule of thumb” (up to 33% short position, 33%-66% neutral and more than 66% long).
Chart 1: Thresholds based on conditional probability distributions
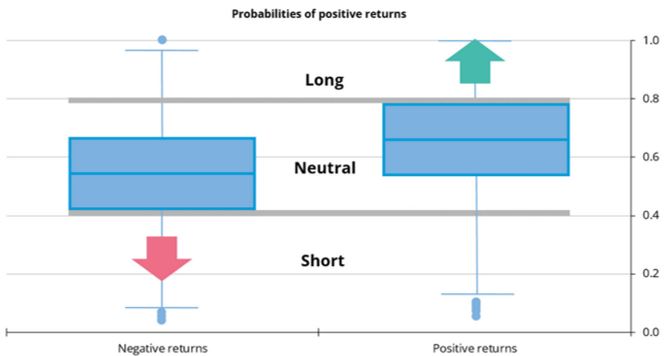
Source: Own elaboration.
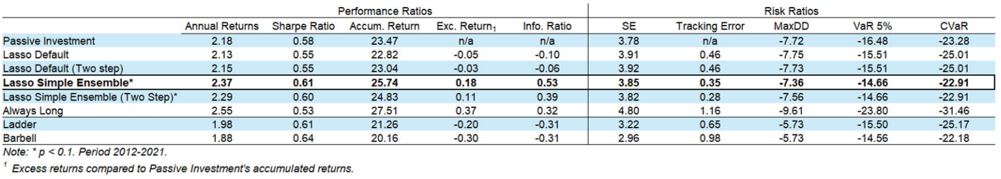
The proposed models (simple ensemble and simple ensemble with two steps) surpass passive investment in terms of performance metrics like annual returns, Sharpe ratio, and accumulated return (Table 1). They also showcase a positive excess return and a superior information ratio. However, these models fail to improve upon the risk ratios when stacked against the Ladder and Barbell alternative strategies, though these strategies carry their own demerits – negative excess returns and the poorest information ratios. Interestingly, compared to the “Always Long” strategy, the Simple Ensemble model exhibits a lower annual return, but it outperforms in terms of the Sharpe ratio and risk metrics. It shows a significantly lower tracking error, maximum drawdown, VaR 5%, and CVaR, highlighting its ability to manage risk more effectively despite lower returns compared to the “Always Long” strategy. Thus, it appears that the Simple Ensemble model offers a more balanced performance-risk profile than either the “Always Long” strategy or the alternative Ladder and Barbell strategies.
Table 1: Performance and risk ratios (annualized figures)
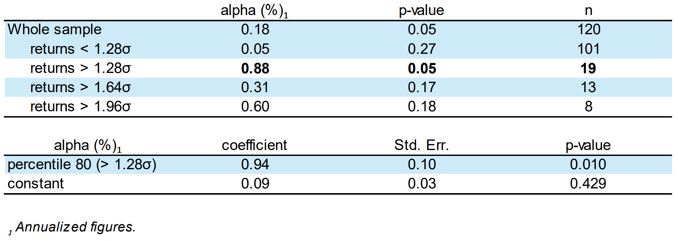
The excess return generated by the model in the out-of-sample period is statistically significant, but primarily attributable to the identification of extreme movements in the dataset. For returns that are below 1.28σ, the alpha is lower (0.05) and not statistically significant (p-value = 0.27). However, when focusing on returns exceeding the 1.28σ threshold, a much higher alpha of 0.88 is found, significant at the 5% level. This underlines the importance of extreme movements in generating alpha in this context. These insights are further confirmed by conducting a regression that specifically identifies these extreme movements (Table 2). The model is estimated to generate 94 basis points (bp) of excess return in the top 20% of the data considered “extreme” (greater than 1.28 standard deviations). According to the regression table, the alpha at the 80th percentile (greater than 1.28σ) is 0.94 with a standard error of 0.10, which is statistically significant at the 1% level (p-value = 0.010). The constant term, representing the alpha when not considering these extreme data points, is 0.09 with a standard error of 0.03, but it is not statistically significant (p-value = 0.429).
Table 2: Lasso Simple Ensemble Two-Step: alpha
The relevance of the variables selected by the model is not stable and changes over time (Table 3). Only two variables appear recurrently in the whole out-of-sample exercise, one related to economics (US import prices) and another related to financial flows (Japanese two-year government bond). US capacity utilization appears 9 out of 10 years, jointly with the 7 year Japanese bond and the Euro Swap Overnight Index Rate (OIS) for one week. Remarkably the betas are not stable year over year. For instance, it seems that at the end of the out-sample period US capacity utilization is losing forecasting power compared to US 1y1y inflation forward rate. This result goes in line with the increase in inflation uncertainty observed in 2021 when the COVID-19 measures started to be loosened and the demand began to lift out.
Table 3: Set of variables selected by year and their betas
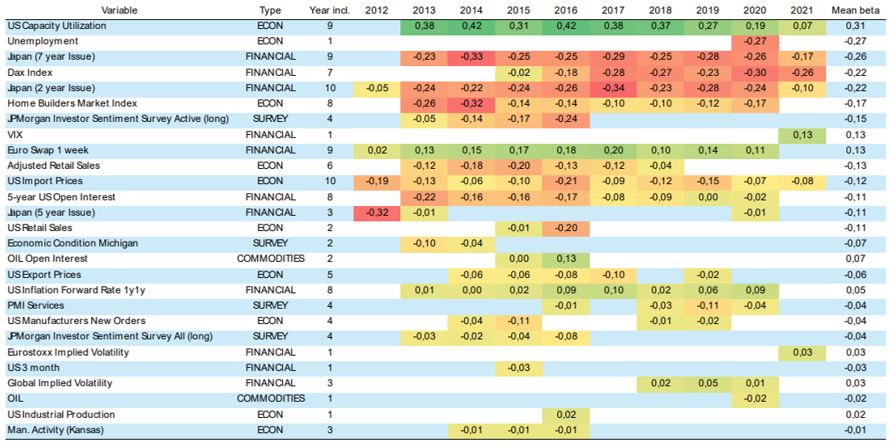
Source: Own elaboration.
In summary, this research provides a contribution to the field of active fixed-income management by employing a machine learning approach using Lasso logit regression. While the models proposed outperform passive investment strategies in terms of key performance indicators like annual returns, Sharpe ratio, and information ratio, they don’t necessarily improve upon risk ratios when compared to alternative strategies like Ladder and Barbell. Our research also points to the pivotal role of extreme market movements in generating alpha, highlighting the model’s efficiency in capturing these dynamics. Moreover, we introduce an innovative algorithm for translating probabilities into feasible portfolio duration signals, offering a systematic way to balance both performance and risk. The ensemble approach further enhances the robustness of the model by mitigating the risks of overfitting and model misspecification. However, our research also reveals the time-varying relevance of selected variables, underlining the necessity for ongoing model refinement and adaptability. The observed shift in the predictive power of variables like US capacity utilization against the backdrop of changing economic conditions emphasizes the importance of keeping the model attuned to dynamic market and economic landscapes. Therefore, while the models offer compelling benefits, we call attention to their limitations and the importance of constant evaluation and adjustment in the complex environment of active fixed-income management.