The views are those of the authors and not those of the Bank of England.
Abstract
In this policy note, we outline the Bank of England’s transition to a repo-led, demand-driven operating framework. We review the lessons we have learnt from the history of our operating frameworks, the public debate on balance sheet normalisation, and our recent engagement with market participants through a discussion paper. In addition, we make the case that the changes in the liquidity environment resulting from the unwind of crisis-era interventions call for an approach based on ‘learning by doing’ for both the Bank and its counterparties as we enter the next stage of transition. This policy note is adapted from a speech delivered by Vicky Saporta on 11 June 2025 at the Bank of Finland and SUERF conference on ‘Old Wisdoms and New Trends’ and published in slightly longer form on the Bank of England’s website.
For more than a decade, central banks including the Bank of England expanded their balance sheets through quantitative easing (QE) financed by the creation of abundant central bank reserves. Now we’re focussed on the process of balance sheet normalisation and the key question is what’s the new normal? At the Bank of England we have been grappling with this question for a number of years. In this policy note, we set out the key features of the Bank’s new operating framework and how our framework has grown out of a process of learning: learning from our history, the public debate, market engagement and from observing how the framework works in practice: or in other words, learning by doing.1
As many readers of this note will be aware, reserves are market participants’ deposits at the central bank. The operating framework is the set of facilities through which the central bank supplies these reserves to the market, and the terms on our facilities guide short-term rates in money markets and provide liquidity insurance to the banking system.2 This is the reason why operating frameworks are core to both monetary policy and financial stability. In the UK, the supply of reserves reached a historical high in the aftermath of the Covid pandemic and are now falling as QE and a crisis-era lending scheme are being unwound (Chart 1).
Chart 1. Reserve liabilities of the Bank of England
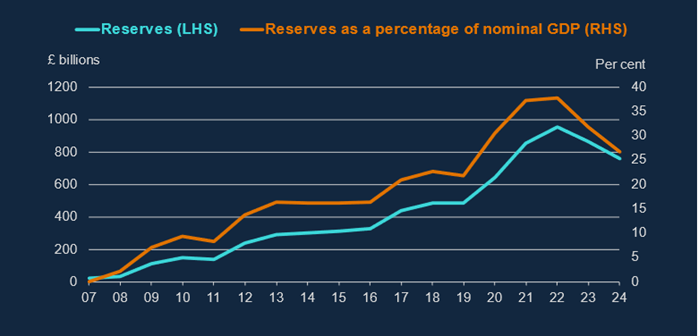
Source: Bank of England, ONS and Bank calculations
Going forward, the Bank intends to let the level of reserves be driven by our counterparties’ demand in our lending facilities. Since these are “repo” or repurchase operations we’re calling the new framework “repo-led, demand-driven”.
We have two weekly facilities to supply the majority of reserves to the market, the Short-Term Repo (STR) and the Indexed Long-Term Repo (ILTR).
The STR supplies unlimited reserves for one week against high quality collateral at our policy rate, Bank Rate. The ILTR supplies reserves against broad collateral at a variable price and quantity for six months at minimum clearing spreads above Bank Rate and the price rises with demand.
Although the STR lends at Bank Rate, the all-in cost is estimated to be 5-10bps higher due to our collateral haircuts and the balance sheet cost to firms. Chart 2 shows repo rates trading within this range, suggesting that the STR is effectively capping secured market rates.
Chart 2. Money market interest rates as a spread to Bank Rate
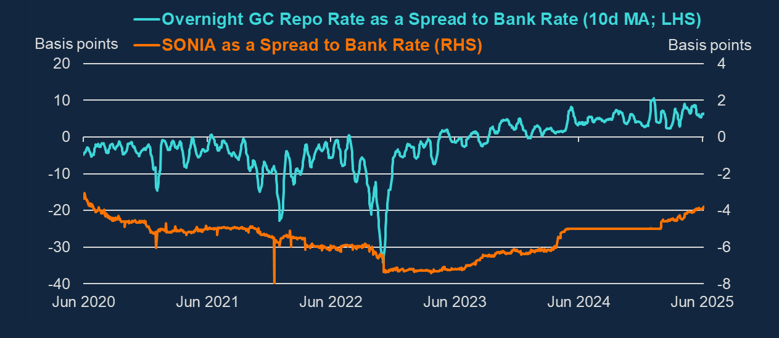
Source: Bank of England, Sterling Money Markets Data (SMMD) and Bank calculations.
There is currently £72bn outstanding in the Short-Term Repo (STR) and £26bn outstanding in the ILTR.3 Although demand in our lending facilities is growing, the stock of reserves is still falling, as the decline in reserves resulting from the unwind of QE and a crisis-era lending scheme (the Term Funding Scheme with additional incentives for SMEs or TFSME) continues to outpace the growth in usage of our facilities, as can be seen from Chart 3.
For now, the facilities are smoothing bumps in the road as we transition towards a new equilibrium. We are watching carefully for where that level will settle. We cannot know ex ante what that level will be and since we are not operating a supply-driven system, we do not need to rely on accurate estimates of demand to determine how much we supply. That said, it is useful to have such estimates for planning purposes, and we regularly ask banks to tell us their preferred minimum range of reserves (PMRR).4 The latest survey in Q1 of this year gave us an aggregate PMRR of £385-540bn, marginally higher than £385-530bn in Q3 2024.5
The operating framework we have designed is transitioning to an equilibrium level of reserves well. Secured money market (repo) rates are being capped by our marginal facility, unsecured rates are slowly increasing towards their new level, and firms are increasingly tapping our facilities.
At the same time, we’ll only know whether our operating framework achieves its monetary control and financial stability objectives under stress after reserves have settled at the PMRR. In the meantime, we can ensure that our design best reflects the lessons from the past, the public debate and what our market analysis and our market participants are telling us. I will now turn to these lessons.
Chart 3. Reserve drain with and without active lending in STR and ILTR(a)
Reserves continue to fall as QE and TFSME unwind, despite an increase in reserves due to uptake of the STR and ILTR
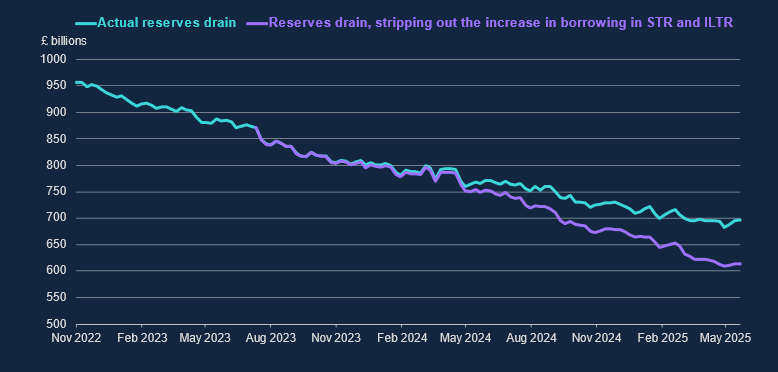
Source: Bank of England.
Our framework seeks to build on the lessons we learned from operating a variety of frameworks before the global financial crisis and during the era of QE asset purchases. Let me give a brief overview of what we’ve learned from these experiences.
The Bank’s modern framework really begins in 2006 when we started to pay interest on reserves.6 This incentivised banks to hold positive reserve balances: the reserve supply increased from the tens of millions to the tens of billions. This enabled our counterparties to absorb short-term fluctuations in reserves demand without causing volatility in market rates. By remunerating reserves at Bank Rate, we anchored short-term market rates to the Monetary Policy Committee’s chosen policy rate – a core feature of the framework that remains in place today. Put simply, we implement monetary policy through the interest we pay on reserves, and compared with our prior frameworks this delivered a significant improvement in our ability to steer market rates. Chart 4 shows the decline in overnight volatility starting in May 2006.
Chart 4. Decline in overnight interest rate volatility in 2006
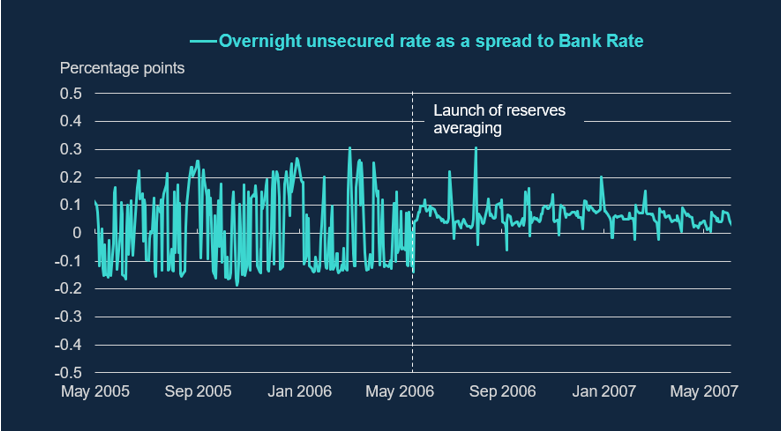
Source: Bank of England.
In addition to remunerated reserves, this framework – known as reserves averaging – had two main elements: voluntary reserves targets and weekly lending operations. In many respects, it resembles the framework to which we are transitioning today – you could say it was repo-led and demand-driven. While it performed well at implementing monetary policy under normal market conditions, it proved inadequate in stress during the global financial crisis.7
The most important lesson we drew from that period – others are summarised in Table – was that rigid individual reserve targets were not resilient to sudden shifts in aggregate demand. Penalties for deviating from targets and the stigma associated with accessing bilateral standing facilities limited the system’s flexibility to rapidly scale up reserves supply. This weakened the Bank’s ability to effectively implement and transmit monetary policy. And when this interacted with widespread credit concerns in liquidity and funding markets, the framework’s reliance on a relatively small number of firms to distribute reserves to the wider financial system broke down: liquidity could not reach the parts of the system where it was needed most.
In 2009, we suspended much of the reserves averaging framework to accommodate the excess reserves created to fund the MPC’s programme of asset purchases. This shift marked the beginning of a supply-driven abundant reserves framework in which the design of our operations was shaped largely by the objectives of QE. Although in this period market-wide lending facilities were rarely used outside stress episodes, we introduced several important innovations that now underpin our repo-led, demand-driven approach. These innovations include a fundamental change in the positioning and supervisory treatment of our facilities8, the widening of access to our framework (from around 40 counterparties in 2006 to over 225 today9), as well as new and normalised facilities such as the ILTR to make lending against a broad range of collateral a permanent feature of our framework.
Table A. Key lessons of different operating frameworks
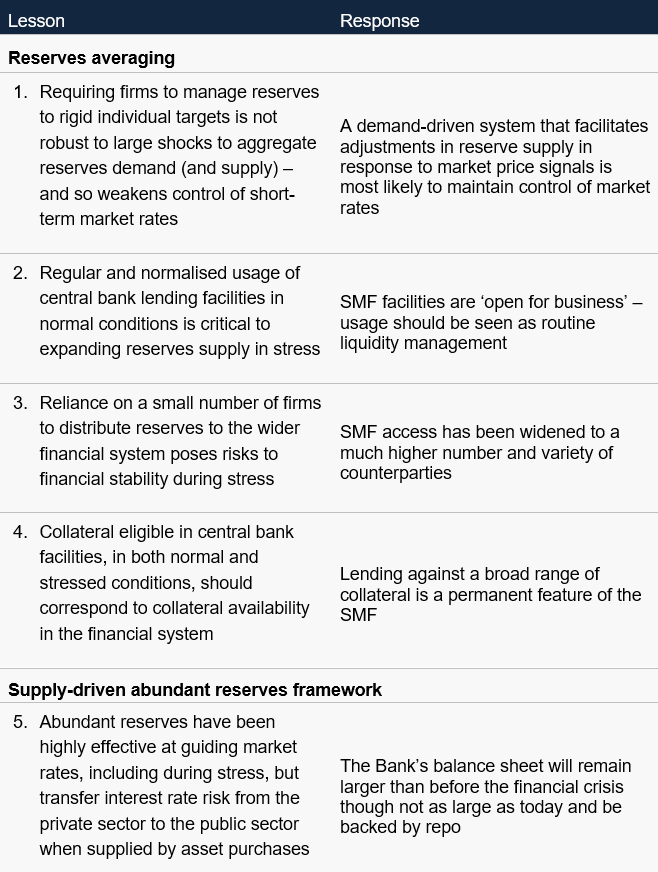
One of the key insights from this period was that abundant reserves supply could be highly effective at guiding short-term market rates, including during financial-stability driven shocks (Chart 5). However, when reserves are supplied via outright gilt purchases, an abundant reserves framework transfers a substantial amount of interest rate risk from the private sector to the public sector. A repo-led framework allows the bulk of interest rate risk to be managed in the private sector, where it better belongs.
Chart 5. Money market rates since before the global financial crisis
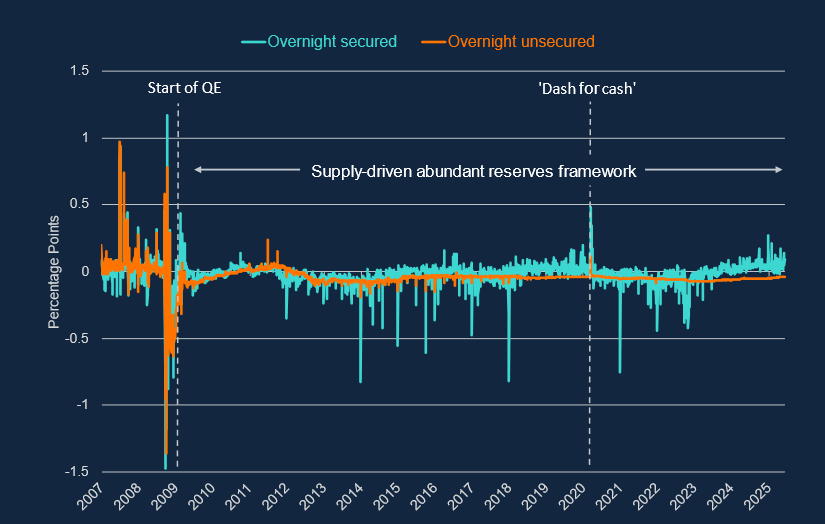
Source: Bank of England, Sterling Money Markets Data (SMMD) and Bank calculations.
Learning from the public debate
How do lessons from our operating framework compare with the public debate?
At the Bank of England’s Annual Research Conference in February, Annette Vissing-Jorgensen of the Federal Reserve Board demonstrated that as monopolist suppliers of reserves, central banks can always achieve monetary control – demand is endogenous to the terms of supply.10 The real question is what framework is most robust to shocks.
The Bank’s experience shows that while both reserves averaging and the supply-driven abundant reserves framework were able to maintain monetary control in normal conditions, reserves averaging struggled to maintain control in stress. The Bank was able to regain monetary control but only after major innovations and the introduction of extraordinary lending schemes, which effectively amounted to an abandonment of the original framework. Although it’s always possible for the monopolist supplier of reserves to keep overnight rates close to its policy target, only certain operating frameworks appear to be robust to unanticipated shifts in demand and supply.
In terms of which framework is more robust, Figure 1 shows a demand curve for reserves with three stylised segments: scarce reserves, ample reserves and abundant reserves.11
Our own experience with QE suggests that abundant or ample reserves systems that avoid the inelastic part of the demand curve are more robust to sudden increases in demand and are very good at delivering monetary control. But are they optimal from a welfare perspective?
Figure 1. Stylised reserves demand curve (a)
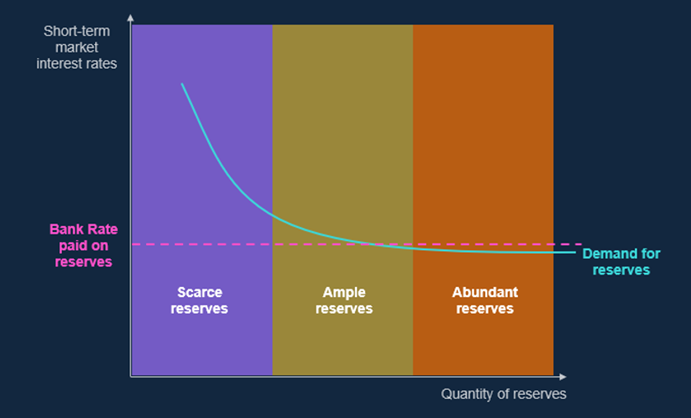
(a) For illustrative purposes we have assigned colours to different regimes of reserves supply. In reality, the boundary between each regime is porous, and so we would not expect to see sudden shifts from ample to scarce reserves, for example.
To answer this question a natural starting point – emphasised by the Dallas Fed’s Lorie Logan – is the classical Friedman rule in which ‘opportunity cost to banks of holding reserves is approximately equal to the central bank’s cost of supplying reserves’.12 Such a rule would imply that the central bank expands reserve supply until demand is satiated at the prevailing policy rate, given that reserve supply is argued to essentially be costless.
But in a separate contribution, Vissing-Jorgensen13 has accounted for the fact that reserves provision is not costless.
Reserves need to be supplied either through the central bank purchasing assets, usually government bonds, or lending against collateral. When purchasing assets, the central bank removes these assets from the financial system by taking title of them. But different assets offer different convenience value related to their inherent liquidity value – that is they confer different benefits from holding them over and above the interest rate they yield. For example, government bonds have a higher convenience value than illiquid assets such as loans because they are more easily monetisable in financial markets and they can be used to fulfil regulatory requirements such as the LCR. So the Friedman rule ought to be adjusted to take account of not only the marginal cost a central bank faces in supplying reserves but also the marginal welfare cost of removing assets with convenience value from the market. This gives rise to Vissing-Jorgensen’s extension of the Friedman rule. Put differently, it is not only balance sheet size that matters, but also asset composition and the latter influences the former. A central bank that in steady state supplies all of its reserves through gilt purchases should optimally have a smaller balance sheet than a central bank that supplies a material stock of its reserves through active lending against a broad set of collateral, other factors being equal.
What does this mean in practical terms? I think it still implies ample central bank balance sheets, as shown in Figure 1, but by accounting for marginal welfare costs, it implies less abundance than the pure Friedman rule would suggest. A larger balance sheet, as we have seen from our QE experience, is more robust to sudden shifts in demand. And if lending can be conducted against a broad set of collateral then this allows the central bank to aim for a larger balance sheet than if it supplied it mainly through government bond purchases.
There are two reasonable challenges to this position. The first is that the market’s ability to effectively distribute reserves affects both their convenience value and that of other assets. Claudio Borio, formerly at the BIS, has noted that higher levels of reserve supply could affect market functioning, depth and the efficiency of intermediation.14 In this world, less efficient money markets for liquidating high-quality collateral might lower their convenience value to investors relative to reserves, shifting the demand curve for reserves outward in normal times, further undermining the efficiency of liquidity and funding markets, or producing larger-than-otherwise demand shocks in stress with financial stability consequences.
In the UK, there is little empirical evidence that abundant reserves have harmed activity in money markets (Chart 6). Granted, unsecured interbank activity is much less likely to play a role in liquidity management15 but secured money market activity, both between banks and between banks and non-banks does not seem to have been affected by the injection of abundant reserves. Moreover, by stabilising market conditions, ample reserves may actually support market liquidity and broader market functioning, as Roberto Perli of the Federal Reserve, has argued, including in the recent tariff-related turmoil in early April.16
Chart 6. Secured money market remains active (a)
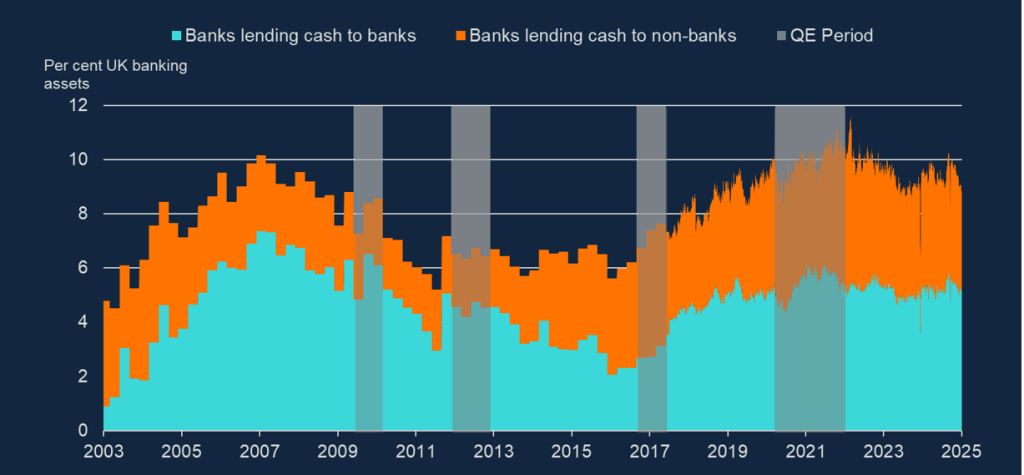
Source: Google trends, Eurostat, own calculations. Source: Bank of England, Sterling Money Markets Data (SMMD), and Bank calculations
(a) Gilt repo activity defined in terms of amounts outstanding. Pre-July 2017 data are estimates derived from Bankstats to match the wider coverage of SMMD. QE periods refer to when the Bank was actively increasing the stock of assets in the Asset Purchase Facility (APF) for QE purposes.
The second challenge to the case for ample reserve supply in normal market conditions is that it fails to account properly for the central bank’s ability to expand reserves supply rapidly in stress. In this view, in a flight-to-safety scenario, the convenience value of reserves is likely to increase relative to other assets. So assessments of the optimal level of reserve supply based on measures of convenience value in normal market conditions may be inconsistent with measures of convenience value in stress. Borio therefore argues not only that the central bank balance sheet should be small in normal times to nurture healthy markets but that they should expand elastically in stress when markets are not functioning well.
However, expanding the central bank balance sheet in stress can’t be assumed. Policy, operational and stigma-related frictions can, if not addressed, slow the speed and scale of response17. We judge that our ability to expand reserve supply is likely to be more reliable if lending facilities are used regularly and widely by our counterparties in normal times – as we are now starting to see in borrowing in the STR and ILTR.18 The more confident firms are that they will be able to borrow from us stress, the less likely they will be to hold excess reserves in normal conditions. But, practically, a framework based on active lending against broad collateral still implies a reasonably ample level of reserves in normal market conditions.
Learning from the past and from public debate can take us only so far, but we also need to test our approach through ongoing market engagement. That’s why towards the end of 2024 we issued a discussion paper on the future of our framework. We received a lot valuable feedback, which has informed the calibration of our facilities.
On 11 June 2025, we published a feedback statement outlining what we heard and how we intend to respond over the coming year and a market notice setting out the final ILTR calibration. I encourage all market participants to read these materials carefully.
This will be an ongoing process of learning by doing – not just for the Bank, but also for firms. That’s because, as we will continue to learn as the liquidity environment changes, including how market liquidity conditions – particularly in liquidity and funding markets – evolve.
Chart 7 sets out the projected path for reserves together with the latest PMRR estimate I referred to earlier. Under certain assumptions about QT, we could arrive at the upper range of this estimate by Q2 2026.
The market needs to be ready for this change. Our message to firms is clear: the Bank’s facilities are open for business—use them, learn by doing, and be ready to adapt as market conditions and pricing evolves.
We will do the same.
Chart 7. We could reach the PMRR next year (a)
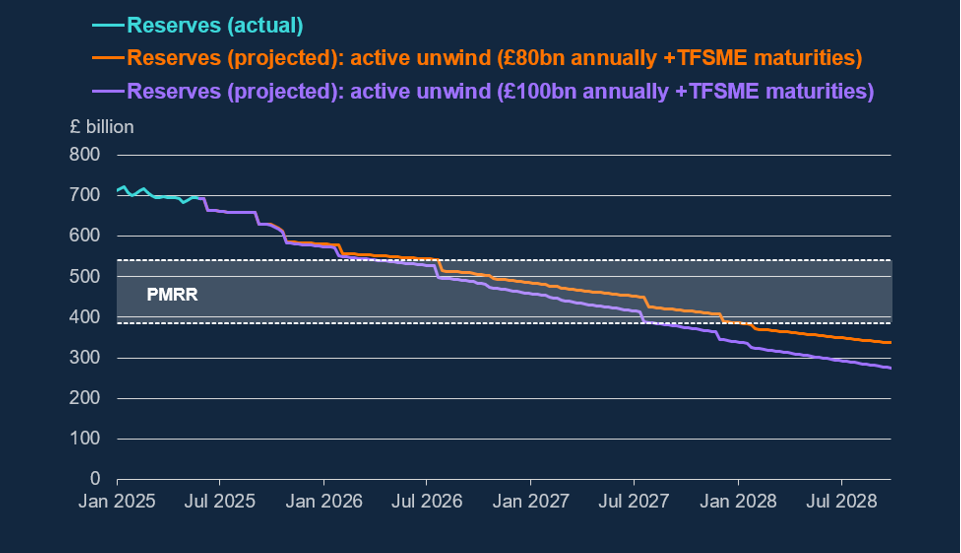
Source: Bank of England.
(a) Reserve unwind shown under different stylised MPC scenarios for QT, based on the different choices during the first three QT annual review cycle. For simplicity it assumes no further change to STR or ILTR usage.
This policy brief is adapted from a longer speech published on the Bank’s website: Learning by doing − speech by Victoria Saporta | Bank of England.
Our Sterling Monetary Framework (SMF) refers to operations with the banking system. Earlier this year we launched the Contingent Non-Bank Financial Institution Repo Facility (CNRF) for pension funds, insurance companies and liability-driven Investment funds (LDIs) with material exposures to the gilt market. The tool will only be activated in the event of severe gilt market dysfunction and its purpose is not to provide liquidity insurance to non-banks, unlike the SMF tools. For more detail see Getting the balance right: ensuring the Bank’s balance sheet can support financial stability − speech by Dave Ramsden | Bank of England and MNI INTERVIEW: BOE Urges Signups For Non-Bank Gilt Facility.
As of 27 June 2025. Results and usage data are available at: Results and usage data | Bank of England
For example the Bank also pays attention to econometric models – such as described in What do we know about the demand for Bank of England reserves? | Bank of England or presented here Quantitative tightening and monetary policy stance − speech by Catherine L. Mann | Bank of England.
As quoted in the December Discussion Paper. In my July 2024 speech, ‘Let’s get ready to repo!’, I cited the Q1 2024 survey estimate and that was £345-490bn.
For details on the change in the Bank’s operating framework at that time – both concerns with the prior framework and the initial thinking around the design launched in 2006, see: Managing the Central Bank’s Balance Sheet: Where Monetary Policy Meets Financial Stability – speech by Paul Tucker | Bank of England.
“The Bank of England’s Balance Sheet: Monetary Policy and Liquidity Provision during the Financial Crisis – Speech by Paul Fisher, 19 November 2009; Bank of England Quarterly Bulletin 2010 Q1; The Development of the Bank of England’s Market Operations: A consultative paper by the Bank of England, October 2008.
Banks, building societies, broker dealers, CCPs (central counterparties) and ICSDs (International Central Securities Depositaries).
Vissing-Jorgensen’s analysis draws on the operational framework of the Federal Reserve and so emphasises the importance of interest rates on reserves as part of making this argument. However, the approach can be generalised to other frameworks and, in the UK, past and present, the net terms across all of our SMF facilities play a role in determining the demand for reserves.
On the Optimal Supply of Reserves – FEDERAL RESERVE BANK of NEW YORK.
Efficient and effective central bank balance sheets – Dallasfed.org
Reserve demand, interest rate control and quantitative tightening (with David Lopez-Salido), 2025.
An important research question is whether the demise of unsecured interbank markets matters in a world where we know that in the presence of credit and liquidity stresses in the banking system they do not appear to work in distributing reserves. One argument is that in their absence we do not have sufficient signals of credit and liquidity distress, although there are many other asset prices that can produce such signals such as CDS spreads, spreads on Tier 1 and Tier 2 bonds and equity prices.
See the important considerations set out by Andrew Hauser in 2023: ‘Less is more’ or ‘Less is a bore’? Re-calibrating the role of central bank reserves – speech by Andrew Hauser | Bank of England.
This point is also made by Lopez Salido & Vissing Jorgensen in their revised working paper (May 2025).