This policy brief is based on OSF Preprint – The overstated effects of conventional monetary policy on output and prices. The views expressed are those of the authors and not necessarily those of the institutions the authors are affiliated with.
Abstract
Based on a comprehensive collection of the empirical literature, this policy brief finds that conventional monetary policy is less effective in curbing inflation than widely assumed. Once the estimates are corrected for publication bias – the preference for statistically significant and theory-conformist results – a 100bp rate hike reduces output typically by less than 0.5% and prices by less than 0.25%, well below textbook predictions. Effects are smaller, slower, and less reliable than conventional wisdom suggests. Moreover, disinflation requires higher output costs. Consequently, monetary policy might be considered a less powerful lever for stabilizing prices and the economy.
As central banks on both sides of the Atlantic continue to weigh the costs of keeping interest rates high, the question of how effective monetary policy really is, remains as pressing as ever. The Federal Reserve recently decided to hold rates steady after one of the fastest tightening cycles in decades, while the European Central Bank continues to debate whether the inflation fight is truly won. Policymakers, financial markets, and households alike hinge their expectations on a key assumption: that raising interest rates significantly dampens inflation and only comes with muted output costs. But does the evidence really justify this belief?
In our new study, we make a comprehensive assessment of what the empirical literature says – and doesn’t say – about the effects of interest rate shocks on output and prices. We synthesize 409 primary studies reporting nearly 5,000 dynamic estimations (so called impulse-response functions, IRFs). Our dataset is the largest ever assembled on the topic and sets new standards in open science practice. The project was preregistered with a pre-analysis plan, and every step of data collection and analysis is fully documented for transparency and reproducibility. Using meta-analysis techniques and, crucially, correcting for publication bias, we find a clear pattern: the power of conventional monetary policy to move output and prices has been systematically overstated.
For decades, economists have debated how much conventional monetary policy – changes in short-term policy rates – affects the real economy. Textbook New Keynesian models predict strong, fast and hump-shaped declines in output and prices following a rate hike. This is due to the behavior of forward-looking agents in these models, who strongly substitute today’s consumption for future consumption if interest rates rise, thereby reducing current aggregate demand, output and prices. Heterogeneous Agent New Keynesian (HANK) models question this standard transmission mechanisms of monetary policy. They emphasize the role of liquidity constrained consumers, who do not engage in intertemporal substitution, but rather orient their spending decisions on current income or cash-on-hand. If monetary policy reduces their current incomes or liquidity, they will reduce their current consumption accordingly. This adds layers of more complicated (if realistic) mechanisms and an interplay between income and wealth distribution and monetary policy. After all, however, under fairly general conditions, the reduced-form macroeconomic effects can be quite similar to those of a standard New Keynesian model. Other more traditional Keynesian models predict generally more muted effects of interest rate hikes on prices as they are rather driven by conflicts between workers and capitalists over wages and prices.
Some influential empirical studies report findings of a comparable magnitude to New Keynesian models, even though the transmission time generally tends to be longer in the data-driven approaches. Others have found weaker effects, puzzling dynamics, or even initial increases in prices in response to contractionary monetary policy – the so-called “price puzzle”. Many papers invent new identification approaches, econometric model specifications or search for better data in order to “solve” the price puzzle.
Against this background, policymakers and model builders often rely on selective studies or simple averages across studies. The danger is that these measures may be biased – because researchers tend to prefer statistically significant findings and those that confirm a dominant theory. In the case of monetary policy, this publication selection bias works as a systematic filter for small negative or positive output and price effects that does not apply symmetrically to large negative effect sizes. However, even if standard theory accurately predicts the direction of effects, random sampling error and model misspecifications should frequently lead to “puzzling” or statistically insignificant (“null”) findings. The systematic exclusion of such seemingly implausible or allegedly less informative results may make sense at the individual paper level. However, for the literature as a whole, it makes the average dampening effects of an interest rate hike on output and prices appear stronger than they really are.
The blue lines and shaded areas in Figure 1 summarize the simple average findings from our meta-dataset of the empirical monetary policy literature:
Figure 1. Average responses to a contractionary 100bp monetary policy shock and the range of bias-corrected responses based on 4,871 estimates
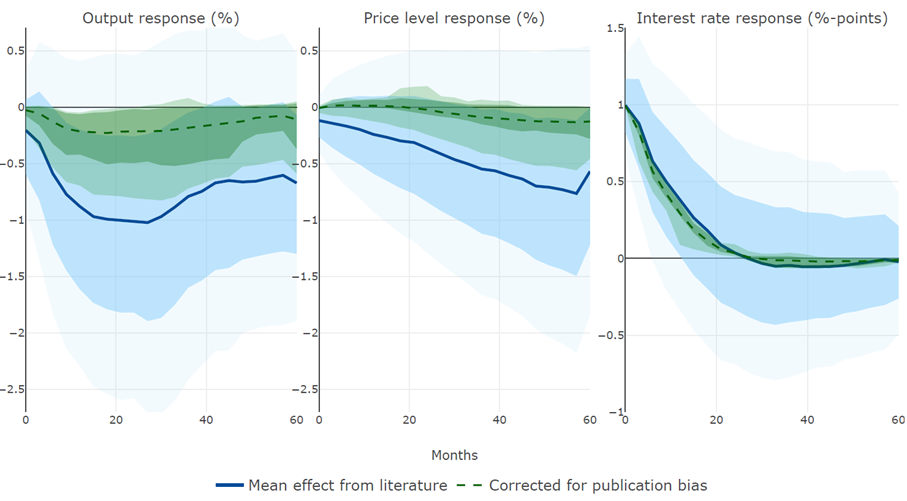
Source: Enzinger et al. (2025). The figures show average responses for output and the price level (in percent), and the percentage point response for the interest rate (blue lines) after a contractionary 100bp shock to the monetary policy rate, along with the blue-shaded average upper and lower 68% and 95% confidence intervals. Additionally, the figures contain a range of publication bias-corrected output, price level and interest rate responses (green area). This range displays the 16th-84th and the 2.5th-97.5th percentile range of bias corrections from up to 42 meta-regression estimates for each response horizon, based on a combination of (i) seven variants of established methods to detect and correct for publication bias and (ii) six levels of winsorization of outliers. The mean of this range is shown as the dark green dashed line.
At first glance, these averages suggest that conventional monetary policy is powerful and in line with standard models: tightening substantially reduces output and eventually lowers prices. Ask your favorite AI to summarize the empirical literature and quantify the average effects and you will likely receive an answer with similar magnitudes.
However, averages and conventional wisdom can be misleading. Indeed, we find systematic evidence of p-hacking and selective reporting: researchers disproportionately report negative and significant responses, while insignificant or “puzzling” results are underrepresented. This matters a lot. Once we correct for publication bias using multiple established methods, the estimated effects for the contractionary 100 basis points interest rate shock are much smaller:
Put differently: the bias-corrected effects are half or less of what a naïve reading of the literature suggests. To reach this conclusion, we applied a battery of well-established tests – including funnel asymmetry regressions, conditional publication probability models, and weighted averages of adequately powered estimates. Across 42 alternative specifications, the corrections consistently point in the same direction: the effects of monetary policy on output and prices are smaller than the conventional wisdom suggests.
As a placebo test, we also examined the responses of the interest rate itself, which is typically documented in papers for the sake of completeness but is not of central concern. As can be seen in the right panel in Figure 1, we found no quantitatively meaningful evidence of publication bias there – signaling that our tests do not pick up some random pattern in the data.
Where might the bias come from? Figure 2, which is based on the seminal work by Andrews and Kasy (2019), shows relative publication probabilities, conditional on the sign and statistical significance of estimates. The reference range is a positive estimate that is statistically significant at least according to the 68 percent confidence interval (z>1), to which we assign a normalized publication probability of 1. For the other ranges (positive insignificant, negative insignificant, negative significant), the publication probability could then be larger, smaller, or similar.
Figure 2. Relative conditional publication probabilities for output (top) and price level (bottom) responses
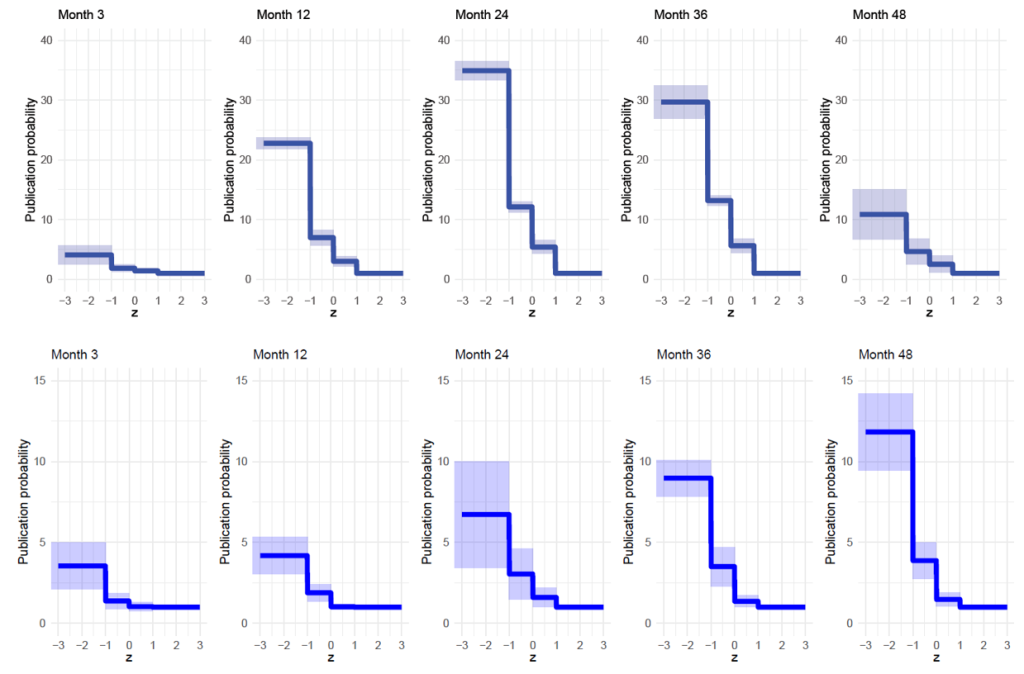
Source: Enzinger et al. (2025). The figures show relative conditional publication probabilities of output and price level responses on the vertical axis for typical ranges of statistical significance (horizontal axis) at different time horizons. Shaded areas show 89% confidence bands. The method is explained here.
As a general pattern, the publication probabilities remain roughly equal for the responses on impact and in the short run, while the differences are remarkable for the medium-run response of output and for the long-run response of prices. These are precisely the response horizons where conventional wisdom would expect a strong and negative effect. For output, it is about five times more likely to observe an insignificant positive effect (at the 68 percent confidence interval) than a significant positive effect (the reference category) after 24 months. It is around 12 times more likely to observe a negative insignificant result and about 35 times more likely to observe a negative significant response. For the price level, the differences are quantitatively smaller but follow a similar pattern, with the strongest differences for the long-term horizon. These patterns can be interpreted such that preference for the expected sign of the response seems equally important as preference for statistical significance.
Not all studies are the same, and we explored how methodological and contextual choices taken by researchers affect the results:
When using a selected sample of only top-tier publications and excluding the somewhat dated recursive models, the mean of bias-corrected estimates peaks at −0.45 for output and −0.3 percent for the price-level response, well within the range of the full sample. The average corrected effect sizes for high-frequency identifications (the most sophisticated and recent approach) are relatively strong for the output response with a peak at around −1 percent but are in line with the full-sample corrected mean effect of −0.15 percent for the price level. There is robust evidence for selective reporting of research findings, regardless of subsampling and including or excluding a long list of possible confounders. Thus, even when we restrict the sample to “best practice” studies, the bias-corrected estimates remain small.
Our findings carry three important implications. First, for policymakers: The evidence suggests that conventional monetary policy is less potent than often assumed. Raising rates may cool the economy and prices, but the magnitude is limited. This should temper expectations about how quickly inflation can be brought down at reasonable cost. Indeed, after correcting for bias, the sacrifice ratio – the output cost of reducing inflation – increases from 1.3 (uncorrected) to 1.7 (corrected). In other words, policymakers may need to raise rates much more strongly and accept larger output losses to achieve the same disinflation.
With inflation in advanced economies finally receding towards target levels but with uncertain outlook in many regions, central banks face difficult trade-offs. Should they keep rates high to ensure inflation returns to two percent, or cut to support growth? In either direction, small steps will likely produce only small effects. This does not mean monetary policy is irrelevant – far from it. But it does mean that a more comprehensive policy mix may be warranted to address current economic challenges. Other policy areas, such as fiscal, industrial, trade, labor market and competition policies may play a comparably larger role for price stability and macroeconomic management than commonly acknowledged.
Second, for macroeconomic modeling: Standard New Keynesian models predict larger and faster effects than we observe in the bias-corrected data. Our results align better with semi-structural models, which tend to show more muted and drawn-out responses. Likewise, applied larger-scale heterogeneous-agent New Keynesian (HANK) models with richer structures can produce impulse-responses that fall into our range of bias-corrected estimates.
Third, for future empirical research: we find that the choice of how to identify monetary policy shocks affects the results. However, identification may have received disproportionate attention in comparison to p-hacking and publication bias, which are more influential according to our findings. Future research on monetary policy should put more weight on questions of open science, replicability, and acceptance of null results, which have received increasing attention in the wider economics profession more recently.
Our study provides a comprehensive quantitative synthesis of how output and prices respond to interest rate shocks. The main lesson is sobering: the effects are real, but smaller, slower, and less reliable than often claimed. Conventional monetary policy remains a key policy tool – but it is not the “all-powerful lever” many models and textbooks portray. For policymakers, researchers, and market participants alike, our analysis might contribute toward a more modest view of what conventional monetary policy can achieve in terms of steering the economy.