

This policy note is based on RaboResearch Global Economics & Markets, Research Note “Europe in the new NATO era“, June 2025.
Abstract
At the historic NATO Summit in The Hague, member states agreed to a significant increase in defense spending, targeting up to 5% of GDP in the coming years.In this research note, we explore the potential economic implications for Europe under various assumptions across four scenarios. The first key takeaway is that execution determines impact: well-implemented strategies could boost euro area GDP by up to 3.4% by 2045, whereas poorly executed approaches may yield negligible returns. We identify and discuss seven critical conditions that distinguish effective execution from ineffective efforts. The second insight is that economic benefits take time to fully materialize. This is particularly true for increased investment in defense R&D, which tends to deliver substantial long-term economic returns.
At the historic NATO summit in The Hague on the 24th and 25th of June 2025, its members made a firm commitment to significantly increase the alliance’s defense spending benchmark. According to this new NATO target, by 2032, member states aim to allocate 3.5% of their gross domestic product (GDP) to direct defense expenditures, with an additional 1.5% of GDP earmarked for investments in defense-relevant assets – such as robust infrastructure and cybersecurity. This add-on also makes the higher target more palatable or acceptable to a broad set of NATO members.
President Donald Trump and Secretary-General Mark Rutte have long advocated for this substantial increase of NATO’s spending norm. With a devastating war now raging on the European continent for over three years and geopolitical tensions mounting, Europe has been jolted from its strategic slumber. There is a growing realization that, for decades, defense has been underfunded and that reliance on transatlantic security guarantees is no longer tenable. Moreover, the 12-day war between Israel and Iran, which has been followed by a truce that could still unravel, suggests that a key supplier of weapons to Europe may no longer be available, as it is likely to require its own defense production capacity. This underscores the importance of Europe becoming more self-reliant and accelerating its rearmament efforts in an effective and coordinated manner. The current political climate appears ripe for a decisive shift, with sufficient momentum to persuade European nations to commit to the new NATO spending framework – an evolution that is not only driven by geopolitical necessity but also increasingly supported by public opinion across the continent.1
The structural weaknesses of Europe’s defense sector were already highlighted in the well-known Draghi Report. And in our own report of 2023, where we underscored the interconnectedness of defense, the industrial complex and raw materials dependencies. While Europe excels in certain areas – such as tanks, submarines, and maritime technology – it suffers from fragmentation where scale is essential, lacks coordination and standardization, and invests relatively little in research & development (R&D). Moreover, Europe remains heavily dependent on non-European suppliers: between June 2022 and June 2023, 78% of defense procurement occurred outside Europe, with 63% sourced from the United States. Even though the EU invested a record €72 billion in defense in 2024, the European Defence Agency (EDA) reports that a large share of this still flows to non-European producers. Moreover, only 1.4% of total EU defense spending is allocated to R&D – far below the structural investments made by the US and China.
In this report, we explore the potential economic ramifications of a renewed defense investment drive across Europe, in terms of economic growth, fiscal consequences and long-term productivity. It is important to note that the economic benefits of European rearmament are far from straightforward. Much depends not only on the scale of the investment – whether 3.5% or 5% of GDP – but also on its design and implementation. Will the stimulus be channelled into strengthening Europe’s own defense industrial base and will Europe’s existing defense industry be more focused on Europe itself, or will the stimulus predominantly flow to countries outside the EU with well-established defense sectors, such as the United States, South Korea or Israel?
Moreover, will there be sufficient safeguards to ensure that these investments translate into tangible increases in defense capabilities, rather than merely driving up prices and boosting profits for defense contractors? And how can we prevent the defense sector from depleting critical resources – human, material, and financial – that are equally vital to the civilian economy (‘crowding out’)?
These are the pivotal questions we address through four distinct scenarios, each quantitatively modelled to assess the broader economic impact of Europe’s potential defense renaissance. But first, we take a closer look at current defense spending patterns as well as the economic mechanisms and effects of defense investments, based on peer-reviewed literature. The focus here is primarily on the economic aspects, excluding geopolitical and strategic considerations.
Before we zoom into the economic impact of increased defense spending, it’s important to examine current expenditures and where the money is going in each country. Our focus is primarily on NATO member states, but when calculating, for example, the average for the eurozone, we have also included non-NATO members, such as Ireland and Austria in the data.
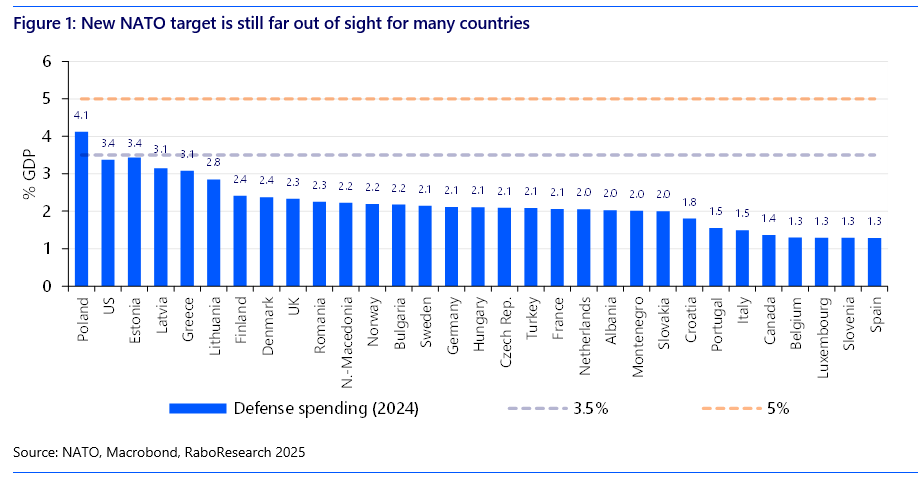
In 2024 NATO members spent 1.5 trillion USD on defense. Figure 1 illustrates the distribution of these outlays across countries, as a percentage of GDP. Poland is the only NATO member state which is currently meeting the 3.5% benchmark, and the United States and Estonia are also close to reaching this target. Countries falling significantly short of the current 2% NATO target include Croatia, Portugal, Italy, Canada, Belgium, Luxembourg, Slovenia, and Spain, and have a long way to go before 3.5% comes in sight.
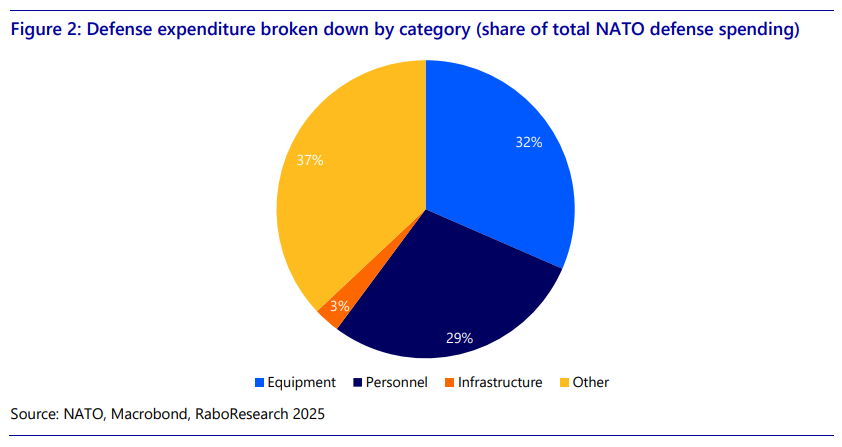
Defense spending consists of several components (Figure 2):
Equipment consists of the procurement of weapons and weapon systems (e.g. artillery systems, missile defense systems), vehicles (e.g. battle tanks, armored fighting vehicles), aircraft (e.g. helicopters, fighter jets), naval systems (submarines, destroyers and frigates, aircraft carriers), cyber and space based systems (e.g. satellites, cyber defense platforms) and ammunition.
Military personnel expenditures include salaries for both military and civilian defense staff. This category also covers education, training, and pensions. The infrastructure component encompasses the construction and maintenance of bases, airfields, ports, and facilities.
The post other consists of a wide range of expenditure not directly covered by the first three components and includes, e.g., defense research & development (R&D), intelligence, cyber intelligence, the maintenance of military bases overseas, maintenance of nuclear arsenal, international missions, and classified programs.
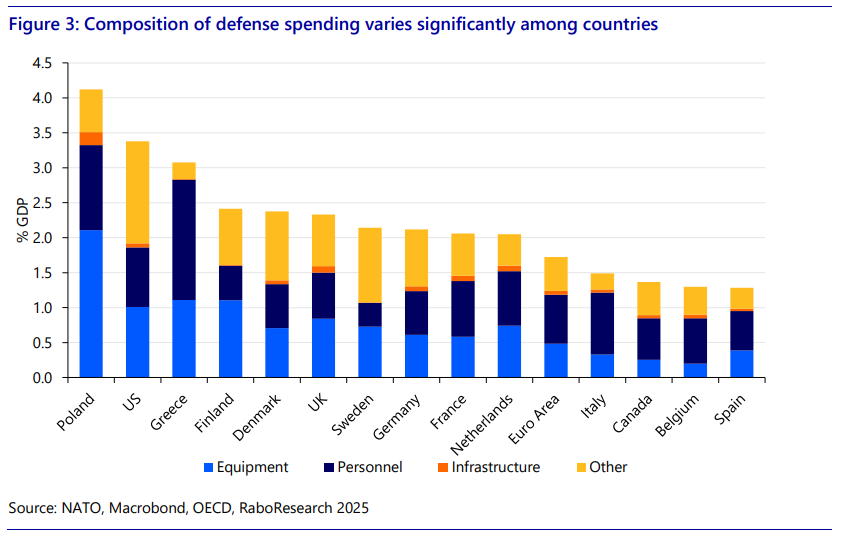
The various components of defense spending differ significantly between countries and regions (see Figure 3). Notably, the relative spending on personnel in the Euro Area and the US does not differ much: the US spends 0.9% of GDP on defense personnel costs, while the eurozone spends 0.7%. However, investment in equipment is considerably lower in the eurozone: the US invests more than 1% of GDP, whereas the EU does not even reach 0.5%.
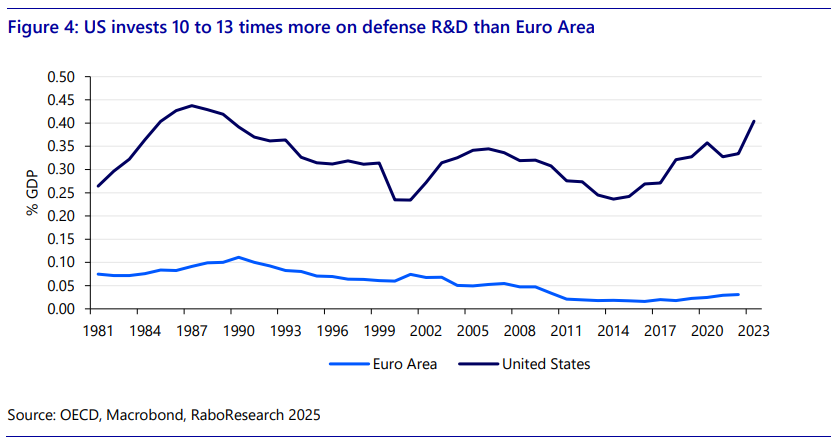
Another striking difference is that the “other” category in the US is much larger than in most other NATO countries. There are several reasons for this. First, the US allocates a significantly larger portion of its defense budget to Research & Development (R&D). This includes investments in new weapons systems, AI, or quantum computing, for example. The US invests 10 to 13 times more in defense-related R&D than the eurozone on average (see Figure 4).
A second explanation is the exceptional international role that the US plays, such as being regularly involved in international (covert or not) military operations. In this context, the US maintains an extensive network of overseas bases that require upkeep. The US also plays a leading role in global security monitoring through worldwide intelligence operations. All these costs fall under the “other” category. Finally, the US possesses a large arsenal of nuclear weapons that must be maintained, secured, and modernized. For example, the US also bears the lion’s share of the cost of the nuclear infrastructure of other NATO countries.
The fiscal multiplier
Central to the discussion on the economic impact of government spending – particularly defense spending – is the concept of the fiscal multiplier: the extent to which an additional amount of government expenditure leads to an increase in GDP.
The multipliers reported in this study are cumulative, meaning they reflect the total effect on GDP over a longer time horizon, rather than just the first year following the spending impulse.
To give an example how to interpret the multiplier reported in this paper: if a study reports a multiplier of 1.2, this implies that one additional euro of defense spending results in a cumulative increase in GDP of 1.2 euros. In other words, the economy gains an extra 20 cents in output for every euro spent. A multiplier effect can arise when government spending triggers additional private investment – for example, through public-private partnerships or increased demand for suppliers. Moreover, when defense projects lead to knowledge development that eventually spills over into the civilian domain, each additional euro of defense spending can generate a societal return that exceeds the initial investment.
A multiplier below one indicates that the economic return is less than proportional to the fiscal impulse, suggesting limited additionality. A negative multiplier implies a net loss in economic welfare – this may occur when defense spending extracts resources (labor, capital, goods (high-tech components, semi-conductors) and commodities) from more productive civilian uses, effectively ‘crowding out’ private sector activity.
Whether a multiplier below 1 is “bad” or “acceptable” is largely a political question, which we will and cannot answer. But important to remember is that a having a strong defense act as a deterrent and thus helps avoid future military conflict and the associated destruction of resources and hence future production. Secondly, a strong military also helps protect economic interests around the world, such as keeping waterways open, protecting foreign personnel and assets, etc. These benefits are not visible in the multiplier but should be viewed against the costs.
Overall impact of defense spending
Based on the literature review in Annex 2, defense spending multipliers typically range between 0.6 and 2.4, depending on the type of expenditure, economic conditions, and national context. The economic impact varies significantly across time, countries, and spending categories – namely consumption, investment, and R&D. Multipliers are highest when spending is domestically anchored, well-coordinated, and supported by neutral or accommodative monetary policy. Financing also matters: short-term debt financing combined with medium-term fiscal adjustment tends to be more effective than immediate tax increases, which can erode the stimulus effect.
During periods of economic downturn, multipliers can rise substantially – typically ranging from 1.6 to 3.4 – due to underutilized capacity and reduced crowding-out effects. In contrast, during economic expansions, multipliers often fall below 1.0 and can even turn negative, as public spending competes with private sector demand for scarce resources.
While few studies explicitly distinguish between defense-related consumption (e.g. personnel and operations) and investment (e.g. capital goods and infrastructure), broader fiscal literature suggests that multipliers for government consumption generally range from 0.2 to 1.2, whereas investment multipliers tend to be higher, typically between 1.2 and 2.4. Consumptive expenditures tend to have more immediate but less durable effects on output.
Impact of defense R&D
Defense R&D has long been a driving force behind transformative technologies that are now part of everyday life and have served as a catalyst for broad societal progress. Innovations such as the internet, GPS, and jet engines originated from military necessity but later proved to be of enormous value to the civilian domain. As such, defense-related R&D is associated with long-term productivity gains and broader welfare effects, particularly when it fosters innovation spillovers into the civilian economy.
The economic impact of defense R&D on productivity remains a subject of debate. While it likely shares many characteristics with general R&D – such as knowledge spillovers – empirical evidence has been mixed. Earlier studies point to potential downsides, including the crowding out of private R&D, misallocation of scientific talent, and limited spillovers due to procurement-related restrictions on intellectual property. Some even report negative productivity effects from defense-related public R&D.
However, more recent research suggests a more optimistic view. When governments absorb the high fixed costs of foundational defense research, they may enable private sector participation that would otherwise not occur. This ‘crowding in’ effect is supported by Moretti, Steinwender, and Van Reenen (2025), who find that a 10% increase in government R&D leads to a 5 to 6% rise in private R&D, with defense R&D playing a central role. Their study also shows that a 1 percentage point increase in defense R&D (as a share of value added) raises TFP2 growth by 0.08 percentage points.
Given the long lead times of defense R&D, Erken, Every and Remmen (2025) focus on long-run effects. Using cointegration panel models across 19 OECD countries, they find that defense R&D does contribute positively to productivity, albeit with smaller elasticities than civilian R&D. Nonetheless, the return on investment can be substantial (around €8 to €9 per euro spent), particularly when accounting for the relatively low baseline levels of defense R&D spending.
Execution of defense spending: do’s and don’ts
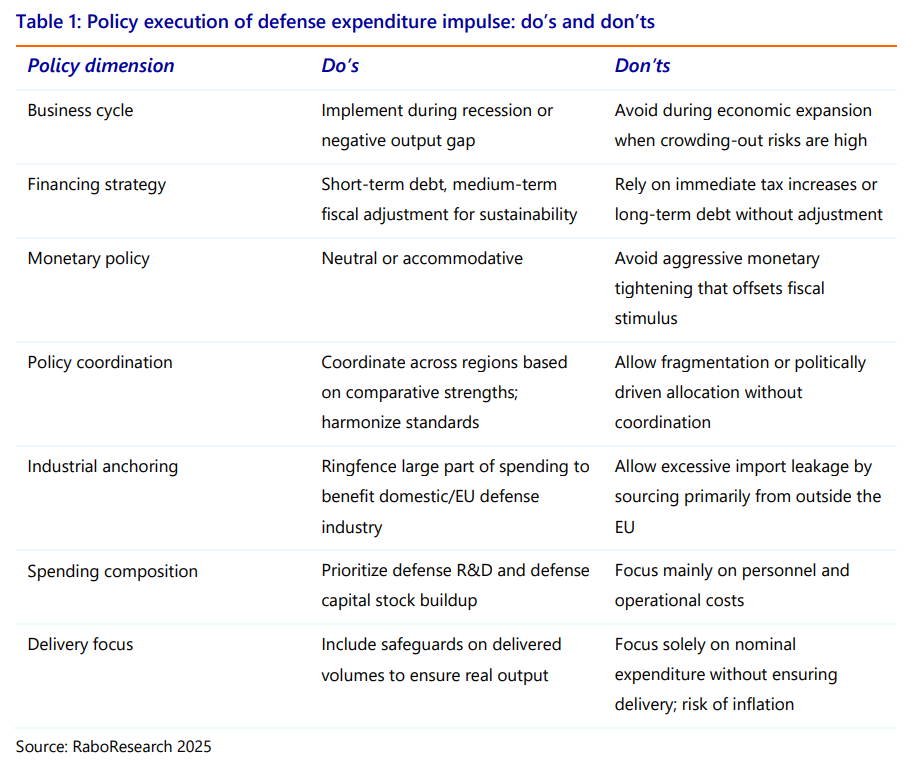
Based on our extensive literature review, we identify seven key conditions that ultimately determine the effectiveness of a defense spending impulse (see Table 1). These seven conditions form the foundation for one of the core dimensions along which we construct and evaluate our policy scenarios.
In this study, we assess the economic impact of increased defense spending on European economies across four scenarios (see Figure 5). The scenarios are based on two key dimensions: (1) whether Europe allocates 3.5% or 5% of GDP to defense, and (2) whether the spending impulse is implemented in a policy-effective manner or not (see Table 1).
Dimension 1: the 3.5% vs. 5% NATO target
NATO member states have agreed to allocate 5% of GDP to defense spending: 3.5% in direct defense expenditures, and 1.5% through defense-related investments, such as military infrastructure, cybersecurity, and strategic industrial sectors. Whether countries effectively spend 3.5% or the full 5% largely depends on how the additional 1.5% is interpreted and implemented. Although countries may formally meet the target, the discretionary nature of the 1.5% threshold creates ample room for fiscal manoeuvring. This flexibility allows governments to meet the benchmark on paper – without committing additional resources – by reclassifying existing expenditures as defense-related.
In the 5% scenario, we assume, however, that the full 1.5% add-on is used for additional defense-related investments. This could occur in response to heightened geopolitical threats – such as further escalation by Russia or a widening conflict in the Middle East that draws Europe in. Under such conditions, member states would likely feel an even stronger sense of urgency to accelerate defense capacity beyond the formal 3.5%, using the remaining 1.5% for tangible investments in military equipment, research, and personnel.
Since the NATO target should be fully achieved by 2032 and beyond, we assume a gradual increase towards the new targets in both scenarios, as it is impossible to increase expenditures with so much in such a short time in a productive way. Speed of this phase-in may vary between countries depending on limitations from resources, such as staffing, materials and financing.
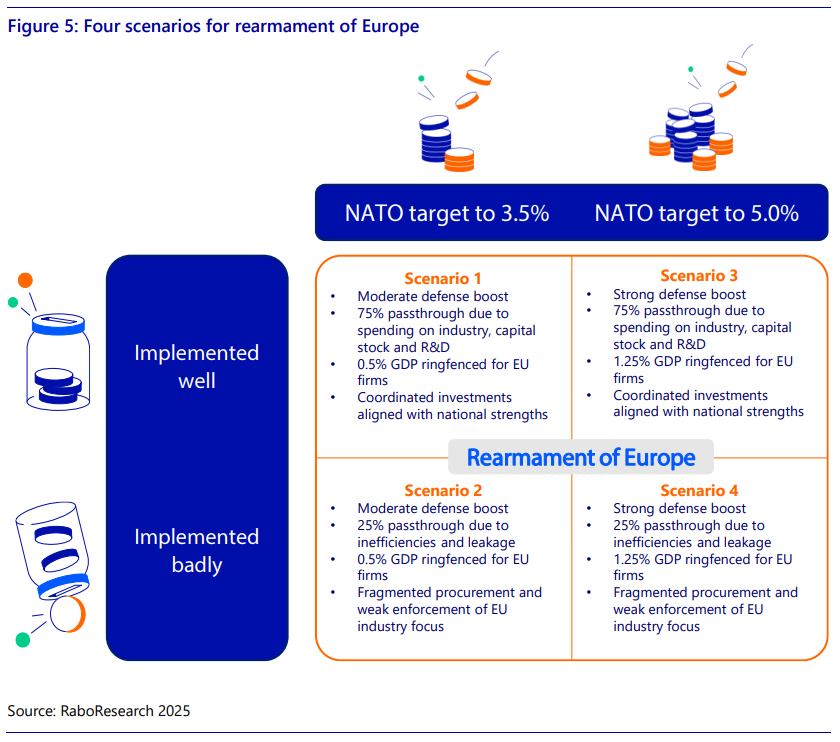
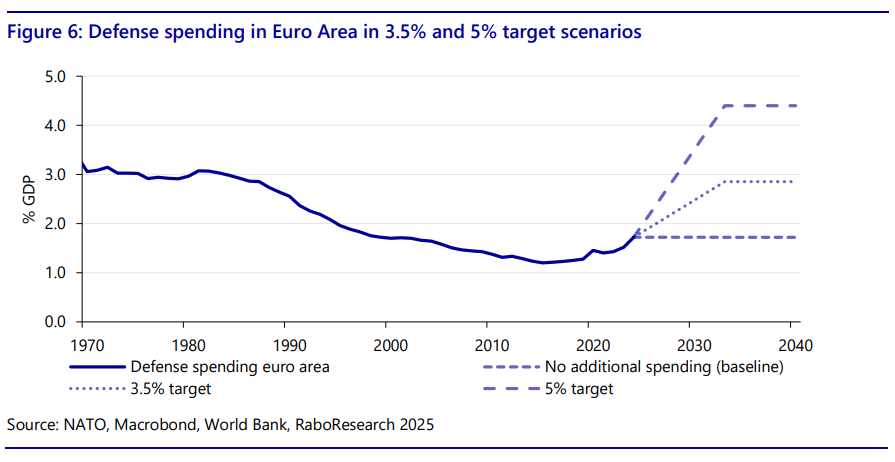
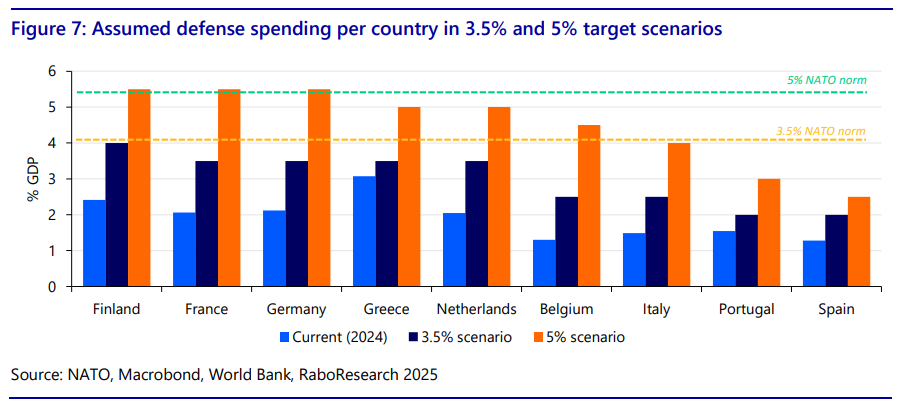
Ultimately, we expect that the euro area will come close to meeting the 3.5% and 5% defense spending targets in our scenarios, but will not fully achieve them (Figure 6). It is unrealistic to assume that countries currently even falling short of the 2% NATO benchmark will be able to reach 3.5% – let alone 5% – in the foreseeable future. Therefore, in our 3.5% and 5% scenarios, we do not assume full compliance across all member states (see Figure 7). Countries such as Belgium, Italy, Portugal, and Spain are not expected to meet the target. In contrast, for countries like Finland, France, and Germany, we assume defense spending will even exceed the agreed 5% threshold.
Dimension 2: executed well vs. executed badly
As highlighted in the literature review, the effectiveness of a large-scale defense spending impulse in the coming years will depend heavily on how it is designed and implemented. It is entirely possible to spend hundreds of billions on defense without producing a single additional frigate, fighter jet, or tank in Europe – without expanding production capacity, recruiting more military personnel, or boosting R&D capabilities. The case of Poland (see Box 1) illustrates how difficult it is for a country to scale up defense spending effectively in a short period of time. This challenge becomes even more complex when an entire economic bloc attempts to do so simultaneously. Below, we outline four key conditions that determine whether the spending impulse is likely to be effective or not, and how these are incorporated into our scenario framework.
Condition 1: Output commitments and prevention of leakage abroad
A poorly executed impulse may arise when policymakers focus more on spending the allocated funds than on securing actual delivery volumes. Without clear agreements, a large share of the impulse could be absorbed by rising prices for defense equipment, higher wages for military personnel, or increased profits and stock prices of defense firms. There is also a risk of capital leakage to non-European suppliers – such as the US, South Korea, or Israel – who have traditionally dominated the European defense market. In our well-executed scenarios, we assume a 75% passthrough from spending to real volumes, while in poorly executed scenarios (Scenarios 2 and 4), this passthrough is only 25%. Additionally, we assume that in the 3.5% target scenarios, 0.5% of GDP in extra spending is ringfenced for European firms, rising to 1.25% in the 5% scenarios.
Condition 2: Macroeconomic timing and composition of the impulse
It is essential that the impulse is tailored to the macroeconomic context of each country. In our scenarios, we account for the fact that countries operating near or above full capacity may trigger inflationary pressures if the impulse is not carefully designed. Countries should differentiate between long-term investments (in the case of a high capacity utilization or positive output gap) and short-term stimulus (when facing a low capacity utilization or negative output gap).
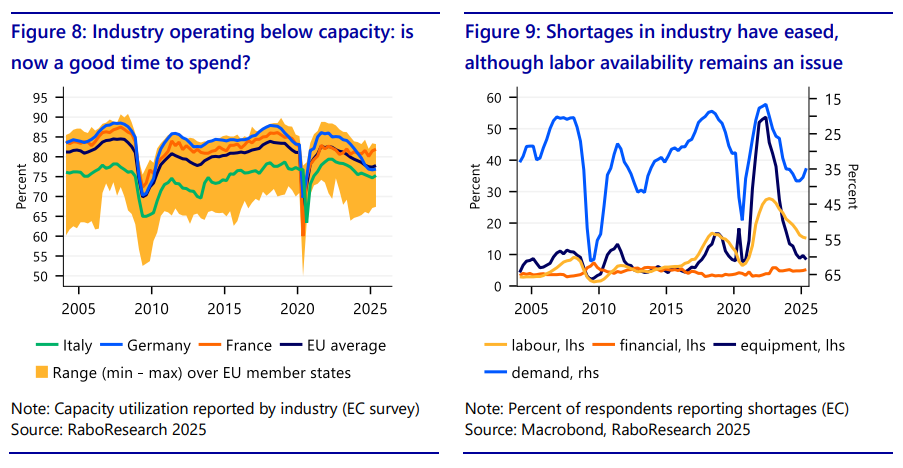
As the chart below shows (Figure 8 and 9), in most EU member states industry is currently operating below its average capacity utilization rate. Notably in big defense producing countries such as Germany and Italy there appears to be room to increase production without causing immediate supply constraints (of course there can be significant differences between sectors within industry). Labor shortages, however, remain a cause for concern in industry. That implies that a labor-intensive investment impulse may be more difficult to deliver than an equipment-intensive investment impulse.
Condition 3: Policy coordination and strategic focus on R&D
Effective implementation also requires coordination across countries, aligning spending with national comparative advantages. For example:
To maximize the impact of the European defense impulse, spending should be aligned with these strengths through coordinated planning, harmonization, and joint procurement. Moreover, sufficient emphasis must be placed on expanding production capacity and boosting defense R&D. In the end the interplay between available personel, fixed capital and technology determines the quality of the defense force. Coordination is also essential in relation to “platforms” and “interconnectedness” of military equipment. Since its strength is essentially determined by the weakest element in the chain.
Condition 4: Avoiding counterproductive fiscal and monetary policy
The macroeconomic policy stance of governments and central banks will also shape the effectiveness of the defense impulse. If countries finance the impulse through cuts in other areas, or if central banks (e.g., the ECB) respond by tightening monetary policy, the positive Keynesian effects of the impulse could be neutralized. In all our scenarios, we assume neutral monetary policy and that short-term spending is debt-financed, with fiscal adjustments only occurring in the medium term.
Raising defense spending: the case of Poland and Greece
Since the Russian invasion of Ukraine, Poland has acted swiftly by significantly increasing its defense investments. In 2022, the country allocated 2.7% of its GDP to defense, rising to 4.2% by 2024. This places Poland well above NATO’s current 2.0% benchmark, making it the undisputed European leader in defense spending.
A portion of this funding has been directed toward domestic production. PGZ, a major Polish state-owned defense company, manufactures howitzers for the Polish army. WB Electronics, Poland’s largest private drone manufacturer, is also in talks with South Korea’s Hanwha Aerospace to produce missiles on Polish soil. In 2022, PGZ signed a contract with South Korea’s Hyundai Rotem to purchase 820 K2 tanks. As part of the agreement, production and maintenance of the tanks will be transferred to Poland starting in 2026.
However, a substantial share of Poland’s defense budget has been spent on foreign equipment, and scaling up domestic production has proven challenging. PGZ initially aimed to produce 150,000 artillery shells annually by 2025, but due to a shortage of skilled labor and missed deadlines, this target has been postponed to 2028. A key bottleneck is the limited availability of critical raw materials. Since the war began, Europe has ramped up ammunition production, but demand for gunpowder, TNT, and other explosives far exceeds supply. Europe has relatively few producers of these essential materials, and supply chains remain complex and vulnerable. Many of the raw materials are sourced from China, and high energy prices combined with strict environmental regulations make local production economically unattractive. As a result, shortages persist despite ambitious expansion plans by firms such as Germany’s Rheinmetall.
Greece offers another example of why the destination of defense spending matters. The country has consistently met NATO’s 2% target – even during its debt crisis a decade ago, it spent relatively more on defense than, for instance, Germany. Despite having several major defense firms, such as Hellenic Aerospace Industry, which manufactures components for F-16s, the vast majority of Greece’s defense budget has gone toward imports and personnel, with relatively little invested in R&D.
We analyse the impact of the scenarios on the European economy using two models: the National Institute Global Econometric Model (NiGEM) and a self-developed European productivity model. More information on the assumptions and the technical explanation of both models can be found in respectively Annex 1 and 3. In this section we discuss the results from the scenario analysis. We show differences with a baseline without a new defense spending package.
Government finances
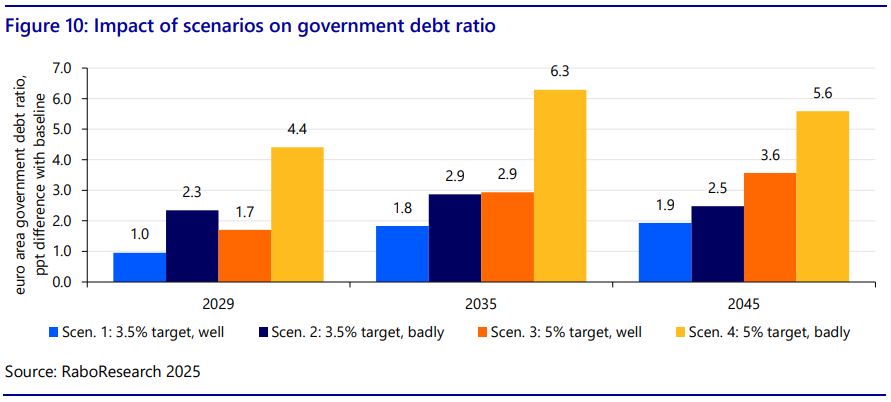
Euro area government debt rises significantly during the first four years (see Figure 10). This is due to increased defense spending, which is not offset by spending cuts or tax hikes, as these expenditures are assumed to fall outside the EU’s budgetary framework. The debt increase is most pronounced in poorly executed scenarios, where limited positive macroeconomic feedback effects occur to partly offset the higher spending.
In the years that follow, taxes are gradually raised, which is necessary to contain further debt accumulation. Without fiscal adjustments, long-term public debt in scenario 4 would end up being 50 percentage points of GDP higher than in the baseline scenario. With fiscal adjustment, debt continues to rise until around 2035 in all scenarios, but then begins to decline – falling further by 2045 and continuing to decrease in the subsequent years.
Macroeconomy
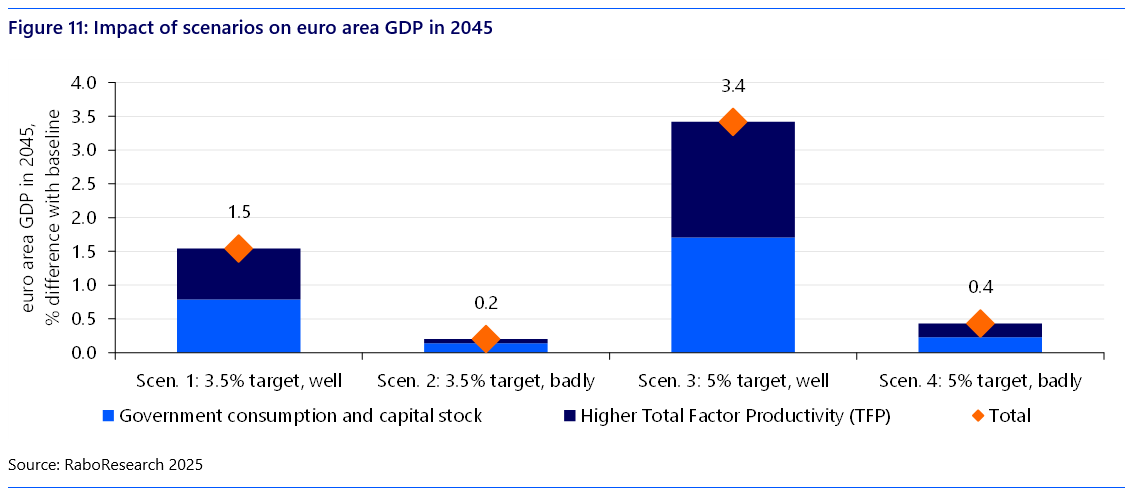
Ultimately, what matters is how the additional debt is used. The long-term impact of increased defense spending on Euro area GDP varies significantly across scenarios (see Figure 11). If the spending boost is well-coordinated, GDP in 2045 is projected to be 1.5% higher than in the baseline under the 3.5% target scenario, and even 3.4% higher under the 5% target scenario. Roughly half of this growth stems from increased government consumption and a larger capital stock, while the other half is driven by gains in total factor productivity (TFP).
In contrast, if the spending impulse is poorly executed, GDP remains roughly unchanged compared to the baseline. This suggests that the additional government debt yields little to no benefit in terms of economic growth – effectively making it a missed opportunity.
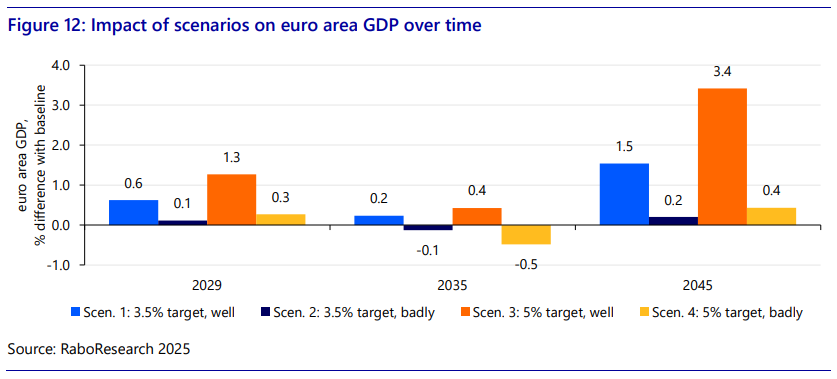
However, the path to 2045 is far from linear. In the first four years, net government stimulus provides a boost to the economy across all four scenarios (see Figure 12). But starting in 2030, when tax increases take effect, the positive impact on GDP fades by 2035 – and even turns negative in poorly executed scenarios.
This decline is driven by two main factors: (1) a portion of government spending is inefficiently allocated to costly and/or foreign defense equipment, financed by economically distortionary taxes; and (2) defense-related R&D partially crowds out private R&D, which typically delivers economic returns more quickly. After 2035, the long term positive effects begin to emerge, as the expanded capital stock and higher total factor productivity (TFP) translate into increased productivity. The key takeaway is that the economic benefits of such investments take time to materialize. Countries should not expect short-term gains, but rather prepare for a waiting period of over a decade before reaping the rewards of today’s higher spending.
Private consumption and private investment
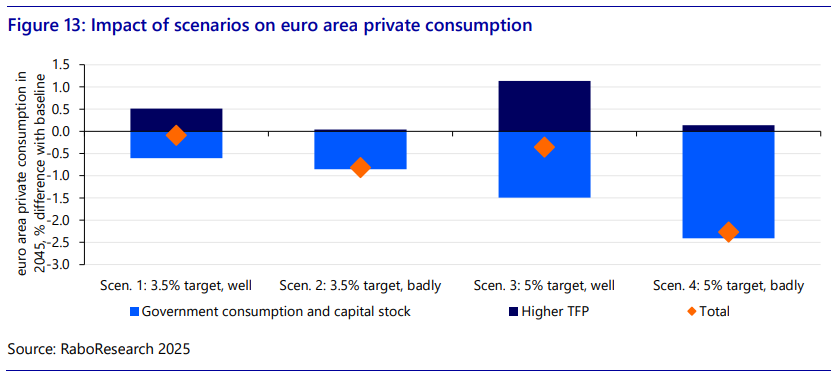
Looking more closely at the economic effects, we see clear differences in the components of GDP. Naturally, government expenditures increase, but the higher taxes that accompany them have a negative effect on private consumption (see Figure 13). Nevertheless, the impact on private consumption remains limited in the well-executed scenarios (scenario 1 and 3). This is because higher productivity leads to higher real wages in the long term. On balance, this roughly offsets the effects of higher taxes. In the case of poor implementation (scenario 2 and 4), however, this is not the case, and only the negative effect of higher taxes remains. This once again underscores the importance of proper execution.
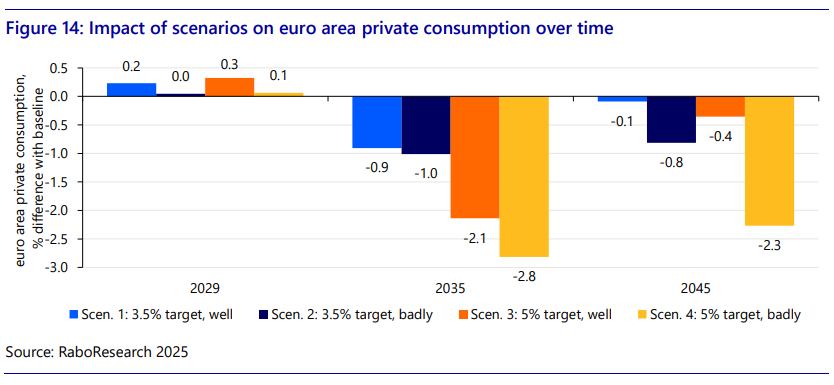
As with GDP, the trajectory of private consumption toward 2045 is uneven (see Figure 14). In the short term, the effects are minimal, as tax increases have not yet been implemented. However, beginning in 2030, taxes start to rise, leading to a significant decline in consumption across all scenarios compared to the baseline. This negative impact gradually fades after 2035 – but only in cases of effective policy implementation (scenario 1 and 3). Without it, there is little to no recovery (scenario 2 and 4).
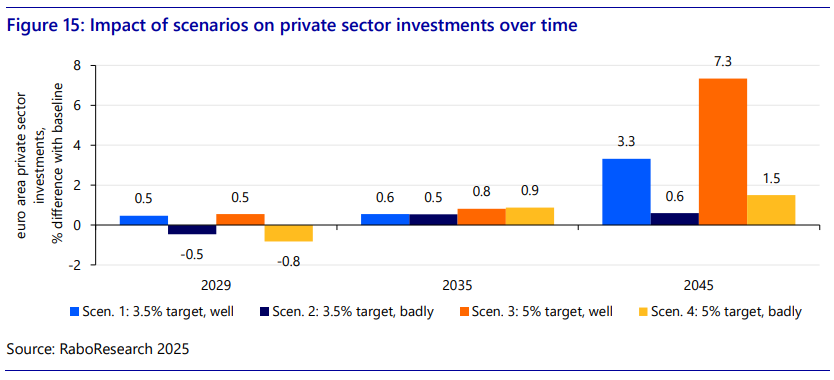
In contrast to private consumption, private sector investments do benefit from higher defense spending (see Figure 15). Both the increase in total factor productivity (TFP) and the boost in GDP growth driven by higher government expenditures have a positive effect. This implies there is additionality between public and private investments. The impact is by far the strongest in the well-executed scenarios (1 and 3). That said, this is also a long-term process – even by 2035, the effects remain relatively limited.
Country-specific effects
The long-term impact across individual European countries in our scenarios varies significantly. These differences depend not only on whether a country already has a substantial defense sector and industry – such as Greece and France – but also on the extent to which its broader industrial base can be transformed to support defense production, as in the cases of Germany and Italy.
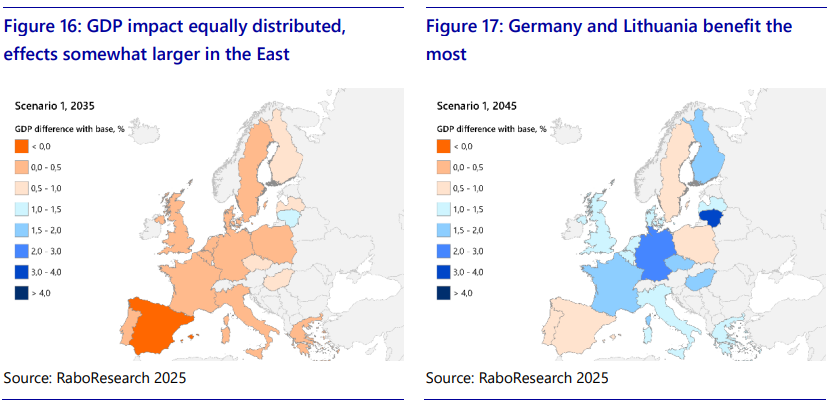
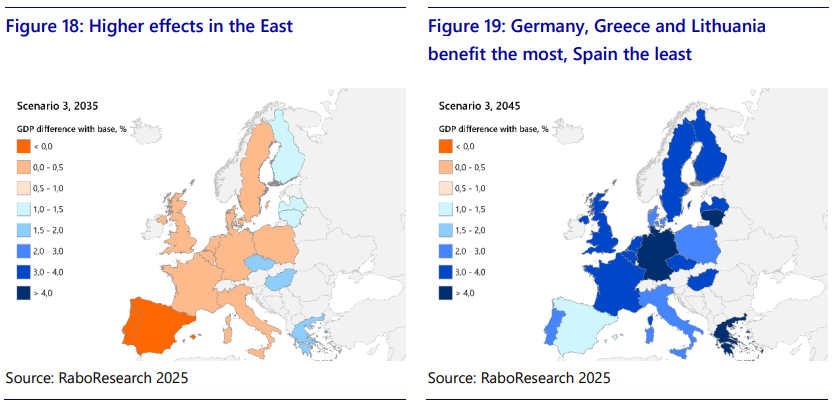
Given that the overall economic impact in the poorly executed scenarios (2 and 4) remains limited, we focus here on the outcomes of the well-executed scenarios 1 and 3. In both cases, the medium-term effects up to 2035 (Figure 16 and 18) show a relatively even distribution across European countries, with nearly all European economies experiencing a GDP increase of around 0.5% as a result of the defense spending impulse. Notably, countries in Eastern Europe – such as Finland, the Baltic States, Bulgaria, Greece, and the Czech Republic – tend to benefit more. This may reflect their stronger incentive to accelerate the defense buildup in response to the geopolitical threat posed by Russia. Spain shows the weakest effects of all European countries in our scenarios. Coincidentally, or not, it is also the only country that has expressed reluctance to fully commit to the new NATO spending target. In contrast, the countries that benefit most in the 5% target scenario in the long term include Lithuania, Germany, and Greece, each showing more than 4% cumulative economic growth (Figure 19). Additionally, the defense spending impulse is expected to generate cumulative growth of 3 to 4% in the Netherlands, Latvia, Finland, Sweden, the United Kingdom, France, Bulgaria, and the Czech Republic.
Bang for the bucks
For policymakers, it is essential to assess the economic return on each additional euro of public spending – commonly referred to as the bang for the buck. This metric compares the cumulative increase in GDP over a given period to the total amount of additional government expenditure. A value greater than one implies that each euro spent generates more in economic output than it costs, indicating a net gain. Conversely, a value below one suggests that the economic return falls short of the initial investment, implying a net loss.
Based on our scenario results, we calculate the bang for the buck separately for two categories:
Government consumption and investment
It is by no means guaranteed that the bang for the buck from public defense consumption and investment will exceed one (see also the extensive literature review in Annex 2). This is partly due to the inclusion of compensating tax increases from 2029 onward in the calculation. A bang for the buck below one does not necessarily imply inefficiency – such spending may still be justified on strategic or security grounds. Moreover, part of the additional funds may be allocated to more expensive or foreign-sourced defense equipment, which does not directly contribute to domestic productivity.
The results (see Table 2) show that the bang for the buck is relatively high in 2029 in the well executed scenario 1 and 3, as tax increases have not yet taken effect. However, it still remains below one, since the economic benefits of a larger capital stock take time to materialize. From 2030 onward, as taxes rise, the bang for the buck declines – and in poorly executed scenarios, it may even vanish or turn negative.
In contrast, in the well-executed scenarios 1 and 3, each additional euro of spending more than pays for itself in the long run – even after accounting for higher taxes. However, this requires patience: the economic returns take time to materialize.

Defense R&D investments
When shifting our focus to the bang for the buck of defense R&D (Table 3), a striking pattern emerges: in the well-executed scenarios (1 and 3), the short-term return of defense R&D is actually negative . This implies that for every euro invested in defense R&D, the economy contracts by €0.70 to €0.80 in the near term compared to a no-investment baseline. The primary reason is that a sharp increase in defense R&D spending diverts talent and resources away from civilian R&D, which typically yields faster productivity gains.
This reallocation – essentially a crowding-out effect – leads to short-term welfare losses, as civilian R&D projects tend to have shorter innovation cycles (five years in our model) compared to defense R&D (ten years). The longer lead time in defense R&D is largely due to procurement processes, which delay the diffusion of new technologies into the civilian domain where productivity-enhancing spillovers can occur.
In contrast, in the poorly executed scenarios, a significant portion of the impulse leaks abroad or is absorbed inefficiently, resulting in less competition for domestic R&D resources. As a result, the crowding-out effect on civilian R&D is more limited.
Looking at the long-term horizon, however – up to 2050 – the picture changes dramatically. In the well-executed scenarios 1 and 3, the cumulative return on defense R&D becomes substantial, with each euro invested yielding €7 to €8 in additional economic output . These multipliers are consistent with the findings of Erken, Every, and Remmen (2025).
Bottomline: patience is required, as the economic benefits of defense R&D take considerable time to materialize.

From our econometric analyses, defense R&D appears to yield the largest impact. But does such an enormous effect really make sense? Looking ahead, there are several compelling examples of defense R&D technologies that have resulted in breakthrough innovations with the potential to transform our daily lives – just as previous defense R&D efforts have done. Examples include the internet, the microchip, mass production of penicillin, nuclear energy, and the jet engine. Table 4 summarizes these promising technological areas.
One compelling example is quantum technology, which could redefine how we sense, communicate, and navigate. Quantum sensing enables ultra-precise measurements, while quantum radar uses entangled photons to detect objects with high accuracy and resistance to jamming. These technologies enhance detection of submarines, UAVs, and stealth aircraft, enable secure quantum-encrypted communication, and offer GPS-independent navigation. Potential civil applications may include advanced medical diagnostics, geophysical mapping, secure data transmission, and even agricultural monitoring – unlocking powerful tools for public benefit.
Although Artificial intelligence (AI) is increasingly embedded in daily life, its potential extends far beyond current applications. In defense R&D, AI enables next-generation dual-use capabilities. A key example is Edge AI, which allows autonomous drones, vehicles and sensors to make real-time decisions without cloud connectivity – supporting faster battlefield responses and cyber resilience. Civil uses include health wearables, predictive maintenance in industry, traffic optimisation and precision agriculture. Cybersecurity is also an important field for defense that is deeply linked to AI, with AI-driven tools securing communications, detecting intrusions and executing offensive operations such as jamming and spoofing. These innovations strengthen digital resilience across sectors, from infrastructure and finance to healthcare.
TABLE 4
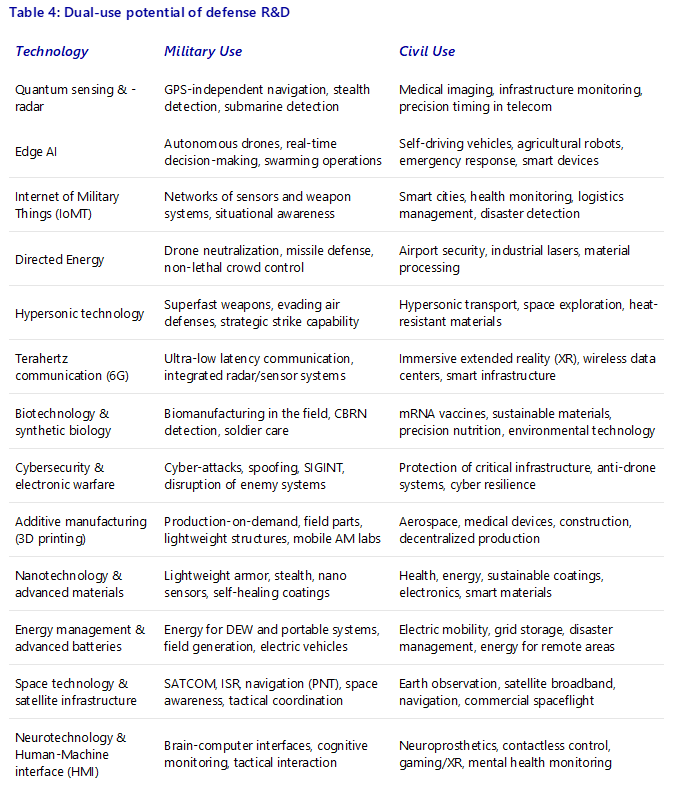
Hypersonic technologies is also an important field in defense R&D. Capable of speeds exceeding Mach 5, hypersonic systems offer rapid strike capabilities and advanced interception tools in defense. On the civilian side, their development opens the door to ultra-fast passenger travel, rapid cargo transport, and more efficient satellite launches. Moreover, the extreme thermal and aerodynamic demands of hypersonic systems are driving breakthroughs in heat-resistant materials and propulsion systems – advancements that benefit commercial aviation and space exploration alike.
Beyond these highlighted areas, defense R&D is advancing numerous other technologies with high civil potential. For instance, nanotechnology and advanced materials are enabling breakthroughs in both military and civilian contexts – from lightweight armor and radar-absorbing coatings to targeted drug delivery and self-repairing infrastructure. Similarly, Directed Energy systems, which rely on high-powered lasers and microwave beams, are capable of disabling drones, missiles and other threats with speed and precision, but may also be translated to laser surgery and advanced manufacturing. Directed Energy systems are also driving innovation in high-capacity energy storage – yielding advances in battery technology that benefit electric vehicles, smart grids, and portable power solutions. Other promising fields include terahertz communication for ultra-fast wireless data, biotechnology and synthetic biology for healthcare and sustainable materials, additive manufacturing for localized production, and neurotechnology for enhanced human-machine interaction. All in all, defense R&D remains a powerful engine of innovation with far-reaching civil benefits. From AI and energy to aerospace and biomedicine, the dual-use potential is vast. As illustrated by some of the examples, the innovations emerging from defense research are not isolated to the battlefield – they increasingly shape the tools, systems, and infrastructure that underpin modern society.
Europe’s renewed focus on defense spending represents a critical inflection point – not only for its security posture but also for its economic trajectory. In this report, we demonstrate that the effectiveness of such an investment drive hinges not just on the size of the fiscal impulse alone, but even more so on the quality of its design and execution.
When implemented in accordance with the seven identified success conditions – ranging from macroeconomic timing and financing strategy to industrial anchoring and delivery safeguards – the defense impulse can serve as a catalyst for long-term productivity growth, industrial resilience, and strategic autonomy. Under these conditions, the euro area could see GDP gains of up to 3.4% by 2045. This means that each additional euro of spending more than pays for itself in the long run – even after accounting for higher taxes. This analysis does not take into account the benefits of increased security, the protection of economic interests around the world and -hopefully- the avoidance of future conflict and associated destruction of life and economic assets.
However, the path to these gains is not linear. From 2030 onward, the fiscal burden of the defense impulse – primarily through higher taxes – leads to a contraction in private consumption. In poorly executed scenarios, this effect persists, while in well-executed cases, productivity-driven wage growth helps mitigate the impact. At the same time, private investment benefits from a crowding-in effect, particularly when public spending is targeted toward capital formation and innovation.
Particularly in the domain of defense R&D, the findings underscore the importance of long-term commitment. While short-term crowding-out effects are a risk, the long-term returns are substantial – provided investments are well-targeted, domestically anchored, and strategically aligned with dual-use innovation potential.
The current weakness in European industry, particularly in several big member states, may offer an opportunity to scale up defense spending in the next few years without causing significant price pressures. But we would also add that it is imperative that this is done in a coordinated fashion and with an eye for potential shortages in materials, personnel etc.
In conclusion, the defense spending impulse offers Europe a unique opportunity to simultaneously enhance its security and economic resilience. Realizing this potential will require disciplined execution, coordinated policymaking, and a sustained commitment to long-term value creation.
For the complete Annex please refere to the attached SUERF Policy Note No, 372, & RaboResearch Global Economics & Markets, Research Note “Europe in the new NATO era“, June 2025
Annex 1: Methodological approach
Annex 2: Literature review
Annex 3: Models
Auerbach, A. J., & Gorodnichenko, Y. (2012). Measuring the output responses to fiscal policy. American Economic Journal: Economic Policy, 4(2), 1-27.
Barro, R. J., & Redlick, C. J. (2011). Macroeconomic effects from government purchases and taxes. Quarterly Journal of Economics, 126(1), 51-102.
Bassanini, A., Scarpetta, S., & Hemmings, P. (2001). Economic growth: the role of policies and institutions. Panel data evidence from OECD countries. Panel Data Evidence from OECD Countries, OECD paper.
Ben Zeev, N., & Pappa, E. (2017). Chronicle of a war foretold: The macroeconomic effects of anticipated defence spending shocks. The Economic Journal, 127(603), 1568-1597.
Berge, T., De Ridder, M., & Pfajfar, D. (2021). When is the fiscal multiplier high? A comparison of four business cycle phases. European Economic Review, 138, 103852.
Bernstein, J. I., & Mamuneas, T. P. (2005). Depreciation estimation, R&D capital stock, and North American manufacturing productivity growth. Annales d’Économie et de Statistique, 383-404.
Bettendorf, L. & Katz, M. (2023), Nieuwe inzichten over multipliers overheidsbestedingen, CPB.
Blanchard, O., & Perotti, R. (2002). An empirical characterization of the dynamic effects of changes in government spending and taxes on output. Quarterly Journal of Economics, 117(4), 1329-1368.
Boehm, C. E. (2020). Government consumption and investment: Does the composition of purchases affect the multiplier?. Journal of Monetary Economics, 115, 80-93.
Cloyne, J., Jordà, Ò., & Taylor, A. M. (2023). State-dependent local projections: Understanding impulse response heterogeneity. National Bureau of Economic Research, no. w30971.
Donselaar, P. (2011). Innovatie en productiviteit: het Solow-residu ontrafeld, Erasmus University Rotterdam.
Dunne, J. P., & Tian, N. (2013). Military expenditure and economic growth: A survey. Economics of Peace and Security Journal, 8(1).
Dunne, J. P., & Smith, R. P. (2020). Military expenditure, investment and growth. Defence and Peace Economics, 31(6), 601-614.
Haug, A. A., & Sznajderska, A. (2024). Government spending multipliers: Is there a difference between government consumption and investment purchases?. Journal of Macroeconomics, 79, 103584.
Guellec, D., & Van Pottelsberghe de la Potterie, B. (2004). From R&D to productivity growth: Do the institutional settings and the source of funds of R&D matter?. Oxford Bulletin of Economics and Statistics, 66(3), 353-378.
Erken, H.P.G., M. Every and W. Remmen (2025). The economic returns on defense R&D, SUERF Policy Brief, no. 1087.
European Commission (2025). The economic impact of higher defence spending, Spring Forecast, Brussels.
Ferrara, L., Metelli, L., Natoli, F., & Siena, D. (2021). Questioning the puzzle: fiscal policy, real exchange rate and inflation. Journal of International Economics, 133, 103524.
Hall, R. E. (2009). By how much does GDP rise if the government buys more output?. National Bureau of Economic Research, no. w15496.
Huang, N., & Diewert, E. (2011). Estimation of R&D depreciation rates: a suggested methodology and preliminary application. Canadian Journal of Economics, 44(2), 387-412.
Ilzetzki, E., Mendoza, E. G., & Végh, C. A. (2013). How big (small?) are fiscal multipliers?. Journal of Monetary Economics, 60(2), 239-254.
Jordà, Ò. (2005). Estimation and inference of impulse responses by local projections. American Economic Review, 95(1), 161-182.
Kiel Institute (2025). Guns and growth: The economic consequences of defense buildups. Kiel Report no. 2.
Li, W. C., & Hall, B. H. (2020). Depreciation of business R&D capital. Review of Income and Wealth, 66(1), 161-180.
Lichtenberg, F. R. (1992). R&D investment and international productivity differences (No. w4161). National Bureau of Economic Research.
Mankiw, N. G., Romer, D., & Weil, D. N. (1992). A contribution to the empirics of economic growth. Quarterly Journal of Economics, 107(2), 407-437.
Moretti, E., Steinwender, C., & Van Reenen, J. (2025). The intellectual spoils of war? Defense R&D, productivity, and international spillovers. Review of Economics and Statistics, 107(1), 14-27.
Nakamura, E., & Steinsson, J. (2014). Fiscal stimulus in a monetary union: Evidence from US regions. American Economic Review, 104(3), 753-792.
Owyang, M. T., Ramey, V. A., & Zubairy, S. (2013). Are government spending multipliers greater during periods of slack? Evidence from twentieth-century historical data. American Economic Review, 103(3), 129-134.
Perotti, R., Reis, R., & Ramey, V. (2007). In search of the transmission mechanism of fiscal policy [with comments and discussion]. NBER macroeconomics Annual, 22, 169-249.
Perotti, R. (2014). Defense government spending is contractionary, civilian government spending is expansionary. National Bureau of Economic Research, no. w20179.
Ramey, V.A. (2011). Identifying government spending shocks: It’s all in the timing. Quarterly Journal of Economics, 126(1), 1-50.
Ramey, V.A. (2019). Ten years after the financial crisis: What have we learned from the renaissance in fiscal research?. Journal of Economic Perspectives, 33(2), 89-114.
Ramey, V. A., & Zubairy, S. (2018). Government spending multipliers in good times and in bad: evidence from US historical data. Journal of Political Economy, 126(2), 850-901.
Sheremirov, V., & Spirovska, S. (2022). Fiscal multipliers in advanced and developing countries: Evidence from military spending. Journal of Public Economics, 208, 104631.
Stamegna, M., Bonaiuti, C., Maranzano, P., & Pianta, M. (2024). The economic impact of arms spending in Germany, Italy, and Spain. Peace Economics, Peace Science and Public Policy, 30(4), 393-422.
Surveys such as this and this one indicate strong public support for increased defense spending in Europe.
Total factor productivity (TFP) growth measures the residual growth in total output that cannot be explained by the accumulation of traditional inputs such as labor and capital and is generally associated with ‘innovation’.