The views expressed in this text do not necessarily reflect the official positions of De Nederlandsche Bank nor the Eurosystem.
Europe’s financial markets remain strongly bank-oriented, and therefore more vulnerable to banking crises than market-oriented economies. In 2015 the European Commission launched a plan to bolster Europe’s stock and fixed-income markets, making them both larger and more integrated. However, “most indicators that measure the size of capital markets, and the degree to which they are integrated, have moved sideways”, The Economist reports.1 In banks’ bond portfolios, ‘home bias’—investors’ tendency to massively overweight the own-country assets—has improved, but not for a high-debt country like Italy, creating the familiar doom-loop link between banks and governments. In stock markets, home bias in investors’ equities portfolios remains pervasive, after an improvement within the Eurozone at the time the common currency was introduced. Similarly, among foreign markets, those that resemble the home market best tend to be relatively over-represented (‘foreign bias’).
One first question this raises, from a policy perspective, is whether the stock-portfolio biases are as pronounced as some data bases suggest. Commonly cited IMF portfolio survey data are rather imperfect because they lump together all investments into e.g. Luxembourg-run mutual equity funds, whether by home investors or not, with investments in Luxembourg companies’ equity. The ECB’s quarterly Securities Holdings Statistics-Sectoral (SHS-S) data, based on reports by all financial institutions from euro-area countries, offers a welcome and much more precise alternative. The ECB provides detailed data on holdings, for each worldwide stock-listed companies (about +50.000), grouped by the investor’s country of residence and, within the country, by investor class (banks, insurance mutual funds, households) and, within the households, all relevant nationality segments. For instance, we know how many shares of Danone or Citi are held by, say, Irish households living in Portugal. We also know how much each of these groups invest in each of 25,000 mutual funds. We can therefore study, for each of these resident groups in the reporting countries, the size of direct holdings in each company, plus the holdings via funds, and thence their total holdings. Most of the 800m potential [investor-group x company x quarter] positions are of course zero, but we still end up with, on average, 165m non-zero cells per year. We can, of course, aggregate these holdings across all stocks per destination countries—the usual numbers studied in the home/foreign bias literature—but we can also look at how balanced the positions are. For instance, do Chilean investments by French households living in Austria resemble a well-diversified portfolio, or are they focused on a few Chilean companies? We can check whether ‘locals’ (e.g. Dutch living in the Netherlands) differ from ‘immigrants’ (non-nationals living in the Netherlands) or ‘emigrants’ (Dutch living abroad). We can verify whether direct stock holdings and indirect ones (through mutual funds) are differently biased, and we are able to compare total bias with the standard IMF results.
The second question relevant for policy is what should be done, if anything, about the twin biases. Whether policy measures are useful at all depends on what underlies the phenomena. In one view, they reflect a behavioural feature: the natural familiarity investors experience with respect to local companies is said to lead to overconfidence and an illusion of control. A radically different view is that investors feel they have an informational advantage about stocks in the local market, and by extension, about stocks from markets that resemble home: they know more about them, and understand the context better. If that is the mechanism, not familiarity bias, the natural next question is whether that advantage is genuine or imaginary. If the information hypothesis holds, there is no immediate cause for concern, and nowadays little is needed to improve information provision in the first place. Behavioural biases, in contrast, are likely to harm rather than help market efficiency.
The two competing views have different testable implications. Familiarity is country-related, not stock-specific, and should therefore be associated with portfolios that (a) heavily load on indirect investments—via mutual funds, that is—while (b) any direct holdings should be well-diversified. Information trading, in contrast, is about specific stocks or perhaps industries, so it should be associated with indirect positions that are smallish and with direct holdings that are quite different from a neutral, market-cap-weighted country portfolio. So if we would see that stronger foreign bias is associated with smaller indirect holdings and less balanced portfolios, that would be consistent with an information explanation. To verify whether the informational advantage is genuine or just wishful thinking, we can then compute excess returns on each group’s country portfolio, over and above the risk-free rate and the part reflecting priced factors, and again check whether those excess returns are stronger when direct portfolios are more specialized and indirect holdings smaller.
The two views also have very different welfare implications. If the bias is based on informational advantage the resulting underdiversification will be compensated by excess returns. In contrast, if it is based on familiarity bias there will be no such compensation, and the bias will lead to a loss of risk-adjusted return compensated only by whatever psychological benefit is achieved by familiarity.
In a full-information, no-frictions world investors would strongly diversify internationally and hold portfolios close to the world-market portfolio, with country weights proportional to the country’s overall ‘cap’ (market capitalisation) scaled by the cap of all the world’s stocks, denoted as wi2. Accordingly the ‘raw’ measure of home bias is commonly defined as the gap between the weight country-i stocks have in the stock portfolio of local investors versus the country’s world-market weight wi. This number is known to be universally positive, and often quite large. We standardise this raw measure by the square root of wi (1- wi), following Cooper, Sercu and Vanpée (2013), but all results reported below remain present when the scaling is omitted.
When measuring raw foreign bias, we eliminate the home-bias effect by looking at the foreign-stock sub-portfolio in itself. So if half of i’s assets are home stocks, all foreign-stock weights are doubled so that the rescaled foreign weights sum to unity. These weights are then again contrasted with the weights the countries would have in the comparable neutral portfolio, i.e. the world weights similarly rescaled after the elimination of country-i (home) stocks. Standardisation is similar to that for home bias.
Now consider the portfolio of country-j stocks chosen by investor group i, like Czech stocks held by Canadians residing in Italy. One relevant metric is funds’ weight, which tells us how much of that is held via mutual finds rather than directly held individual stocks. The second one is the Cremers and Petajisto (2009) active share statistic, defined as half of the mean absolute deviation between stock k’s weight in i’s portfolio and k’s cap-based weight that would have been chosen by a passive investor. Active Share equals zero for a perfectly neutral portfolio and approaches unity when all if i’s money is put into a single, absolutely tiny stock.
Part of our work consists of documenting the size and characteristics of the biases using the new, superior data, including look-through investments via funds, and the differences between direct and indirect position or between portfolios selected by ‘native’, ‘emigrant’ and ‘immigrant’ groups. Lastly we formally investigate the familiarity versus information issue via regressions. We focus on foreign bias, because for home bias we just have one clear (and large) investor group per country; that is, we would have just 13 observations per quarter, and each such number would be aggregated over many investors (viz. all national residents). By looking at e.g. immigrants’ portfolios we have many more observations less subject to aggregation bias. The main analysis is based on two regressions, that relate either foreign bias or excess return to Active Share and Funds’ Weight plus a set of controls commonly used in this literature (like both countries’ sizes and income/capita, bilateral trade links and physical distance, and so on).
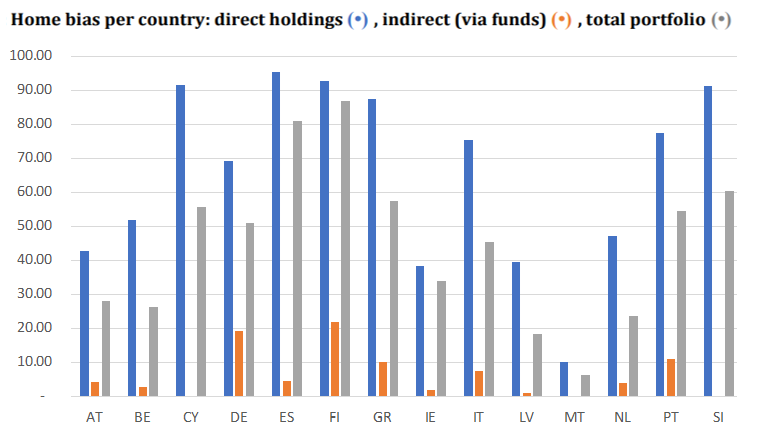
Figure 1
Portfolio bias should be studied at two levels: the passive part that occurs via mutual finds, and the direct part where stocks are selected by the investors themselves. Our analysis indicates that, in their direct investments, households seem to select stocks based on informational advantages and not so much on the basis of familiarity: overweights (positive foreign bias) are associated with higher Active Share numbers and smaller Funds’ Weight numbers, and these portfolios do provide better returns. In the indirect mutual fund positions in stocks, the excess returns are virtually zero, whereas on the direct stock holdings households gain excess returns, especially for more actively managed portfolios. Whether the profitable active positions are present in most portfolios versus held mostly by a subset of investors or not is hard to tell from our data.
An important part of the context for our results is the continued rise of passive investment strategies in the mutual fund sector where outperformance of the benchmark returns is neither expected nor rewarded. Passive investment strategies via tracker or exchange-traded funds are supported by theoretical and empirical insights from academia: such index funds offer welcome diversification, low ‘churn’ costs and modest management fees. When applied internationally, passive investing can reduce foreign bias if it is used to achieve full international diversification. However, our results show that this effect is incomplete, because funds are also used to hold foreign equities where the holdings exhibit familiarity bias.
Active investment—‘speculation’ in the F. Black (1995) sense—is not naturally done via funds: indirect investment would ignore the end investor’s own information and insights, and empirical studies show that, in funds, trading costs and management fees outstrip any gains from active management. Our finding here is that, despite the rise of passive investment, active selection remains alive, explains part of portfolio bias, and is successful. That success is not just privately relevant, but also socially so: good active management contributes to market efficiency and improves market efficiency.
We are grateful to Pedro Barroso, Harjoat Bhamra, Maurice Bun, Ruth Giimeno, Marcin Kacpercyk, Bharat Parajuli, David Schumacher, Giorgia Simion, and participants at the 11th Portuguese Finance Network Conference, the 34th Australasian Finance and Banking Conference, 2022 European Winter Finance Summit, 2022 Global Finance Conference,2021 World Finance and Banking Symposium, and the DNB 2022 Research Seminar for helpful comments on the Boermans, Cooper, Sercu and Vanpe e (2022) working paper.
Black, F. (1995). Hedging, speculation, and systemic risk. Journal of Derivatives, 2(4).
Boermans, M. A., Cooper, I. A., Sercu, P. and Vanpée, R. (2022). Foreign bias in equity portfolios: Informational advantage or familiarity bias? DNB Working Paper 742.
Cooper, I., Sercu, P., Vanpée, R., et al. (2013). The equity home bias puzzle: A survey. Foundations and Trends in Finance, 7(4):289416.
Cremers, M. K. J. and Petajisto, A. (2009). How active is your fund manager? A new measure that predicts performance. The Review of Financial Studies, 22(9):3329–3365.