Figure 1: Major central banks have started unwinding their balance sheets
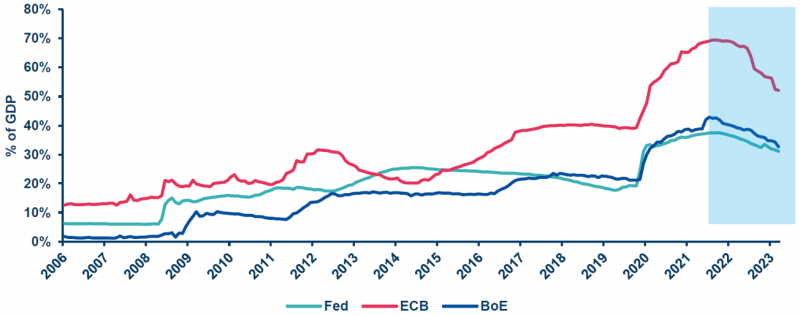
All three major central banks hold substantially larger balance sheets relative to the size of their economies compared to before the GFC, ranging from about 30% of US GDP for the Fed, to 50% of Eurozone GDP for the ECB. More importantly for financial markets, government bonds comprise the bulk of CB holdings. Of the Fed’s USD 8tn balance sheet, close to USD 7.4tn are Treasuries and Mortgage-Backed Securities (MBS).
Figure 2: Composition of major central banks’ balance sheet assets
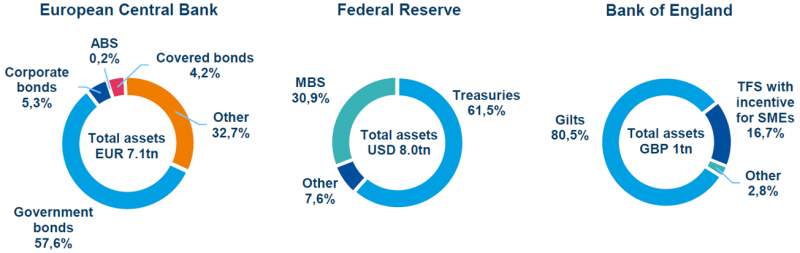
Source: Amundi Investment Institute on Datastream. Data as of end Q3 2023 (or most recently available). ABS: Asset-Backed Securities. TFS: Term Funding Scheme. SME: Small and Medium-sized Enterprises.
To avoid excessive monetary tightening, central banks will likely unwind their asset holdings at a gradual pace. A process that is already underway through reduced reinvestment by the Fed, no reinvestment of maturing APP securities by the ECB (since the second half of 2023), and active sales by the BoE.2
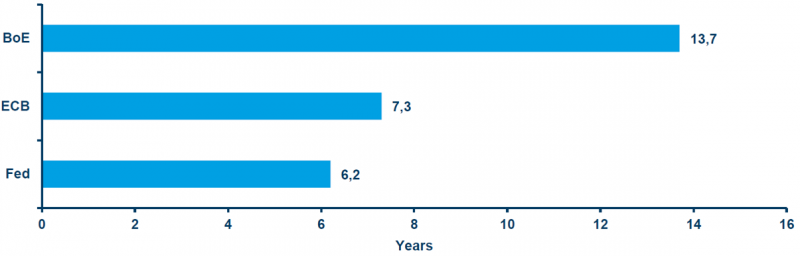
Figure 3: Weighted average maturity of central banks’ bond holdings
How quickly central banks can unload their holdings, and the impact this will have on market yields, will also depend on how much additional debt (net issuance) governments might issue, since that will also have to be absorbed by markets.
To gauge how much additional debt governments might issue we are using the projections for public deficits from the IMF’s World Economic Outlook forecast until 2028. For 2028 to 2033, we assume nominal GDP growth rates and deficit/GDP ratios are unchanged at their 2028 projection. Note that in the case of the United States, this implies quite a high deficit of 7% of GDP per year, and a gross federal debt of around USD 57.8tn in 2033 (slightly higher but comparable to the Congressional Budget Office’s USD 52tn projection). In the case of the Eurozone and the UK, smaller projected deficits mean that the nominal debt will rise less by 2033.
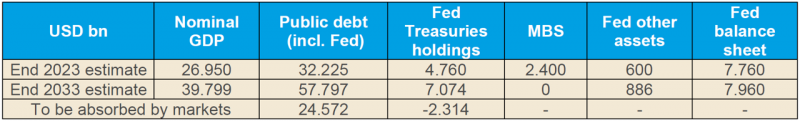
Table 1: Illustration for the unwinding of the Fed’s balance sheet
For the European Central Bank there is even less guidance on what might be deemed an appropriate ‘steady-state’ balance sheet in terms of size or composition. On the one hand, holding public government securities is not a part of the ECB’s conventional monetary policy operations. The Eurozone central bank was highly explicit that QE would be temporary, including when challenged by the German constitutional court. Moreover, the ECB might also seek to rapidly reduce or eliminate its inventory of public securities to make financial and political room for potential uses of its new Transmission Protection Instrument (TPI).
Table 2: Illustration for the unwinding of the ECB’s balance sheet
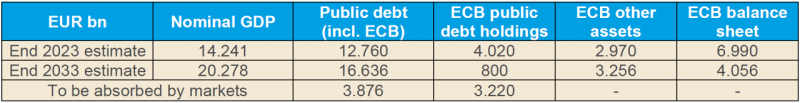
Table 3: Illustration for the unwinding of the BoE’s balance sheet
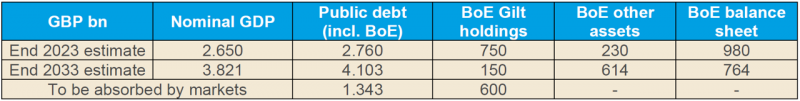
Figure 4: Impact of central bank balance sheet normalisation on market yields
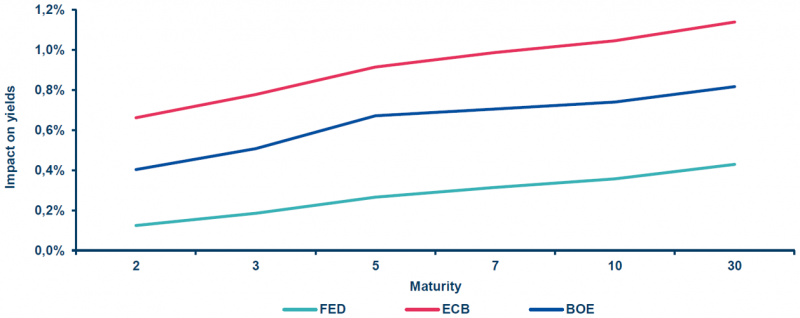
This relatively sanguine view, however, does rest on some important caveats. First, that central banks normalise in an orderly way, taking market conditions into consideration in order to determine how much to sell each year. And, more importantly, governments recognise both the high debt they are carrying as a result of recent shocks, and the reduced space for fiscal manoeuvres. Central banks won’t be in a position to underwrite fiscal excesses in a higher inflation environment, and within the Eurozone, countries with bigger debt burdens will see a larger increase in their borrowing costs. Finally, our simulation does not account for possible second-round effects, for example, tighter fiscal constraints leading to lower growth.
Figure 5: Higher rates for government debt… … lower valuations across other major assets
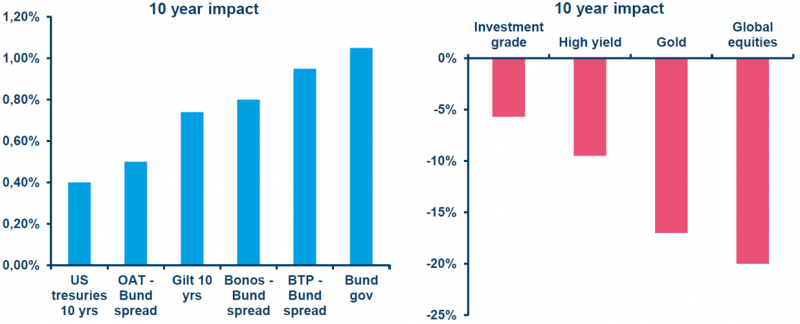
Beyond government debt markets, higher rates for safe assets will lead to lower valuations across other assets (higher risk premia), possibly exacerbated by less abundant liquidity (with less leverage). But here, too, we expect a gradual adjustment. The cumulative valuation adjustment over the next 10 years may be around 20% lower for global equities, 10% for the global high yield segment, 6% for investment grade credits, and 17% for gold. All of these could, of course, be offset by higher productivity and stronger growth.
Target 2 Claims among NCBs (National Central Banks) within the Euro zone are created by cross-border flows in central bank money, corresponding to the settlement of cross-border transactions that are in most cases initiated by private entities.
At end September, the Fed’s maximum monthly reduction pace was USD 60bn in Treasury securities (maturing Treasuries or T-bills) and USD 35bn in MBS, with no active sales. Since the start of its QT in June 2022, the Fed’s Treasury Securities portfolio has been reduced by c. USD 810bn (or 14% of the total) and its MBS portfolio by c. USD 260bn (or 10% of the total). The ECB has stopped reinvesting maturing APP securities but is not engaged in active sales. It has unwound c. EUR 120bn of government bonds since the beginning of its QT in March, or 3% of the total (including PEPP). The BoE was engaged in a combination of no reinvestment and active sales and has just stepped up its planned reduction pace to a total of GBP 100bn in Gilts between September 2023 and September 2024. (Since the beginning of its QT in February 2022, it has reduced its Gilt portfolio by c GBP 100bn, or around 11% of the total, and disposed of the vast majority of its corporate bond portfolio).
See for instance: Federal Reserve Bank of New York (2023); Congressional Budget Office (2023); Crawley et. al (2022).
Isabel Schnabel mentioned “a larger steady-state balance sheet, potentially including a structural bond portfolio” in her ‘Monetary policy tightening and the green transition’ speech at the International Symposium on Central Bank Independence, Sveriges Riksbank, Stockholm, 10 January 2023.
Isabel Schnabel also mentioned that once excess liquidity is absorbed, the Eurozone’s balance sheet may still need to be about three times the size it was in 2007, during her speech at an event organised by Columbia University and SGH Macro Advisors, New York, 27 March 2023. This amounts to EUR 3.6tn, which is not fully inconsistent with our EUR 4tn assumption for 2033.
Simulations are based on the Nelson Siegel (NS) methodology and proprietary tools, https://research-center.amundi.com/article/advanced-investment-phazer-guide-dynamic-asset-allocation. This approach for valuing bonds follows two steps: first, we use the NS model to identify the factors that determine the yield curve. Then, we model each factor using consistent macro-financial variables, which allows for robust and consistent valuations across maturities and the slope of the yield curve. See Nelson and Siegel (1987), and Diebold and Rudebusch (2013).