Policy rates at the effective lower bound – and in some cases even negative – over sustained periods, substantially reduced the available headroom for central banks to respond using conventional interest rate instruments. As a result, many central banks resorted to other, non-traditional or unconventional policies, e.g. Large Scale Asset Purchases, Forward Guidance, Swap Lines, to restore price stability when the standard bank rate proved ineffective due to the zero lower-bound (e.g. Swanson, 2021; Inoue and Rossi, 2019). However, little is known with regards to the impact of such policies on the tail risks of exchange rates.
Established literature examining the overall impact of monetary policy on exchange rates conclude that a monetary policy easing (tightening) would result in depreciation (appreciation) of the domestic currency relative to other currencies (see for example, Rogers, Scotti, and Wright, 2014; Kearns and Manners, 2018; Inoue and Rossi, 2019). Similar to conventional policy, unconventional tools have a profound impact on exchange rates (see for example, Rogers, Scotti, and Wright, 2018; Swanson, 2021; Ferrari, Kearns, and Schrimpf, 2021.
The literature has also examined the impact of monetary policy instruments on the risk of financial assets and the consensus seems to suggest that such instruments have contributed to the reduction of risk (see for example, Gambacorta, Hofmann, and Peersman, 2012; Bruno and Shin, 2015). In contrast, the literature studying the impact of monetary policy instruments on the tails of exchange rates is very limited. Notably, Hattori, Schrimpf, and Sushko, 2016 present evidence that unconventional monetary policy announcements and asset purchases by the Fed substantially reduce perceptions of tail risks in the stock market. Alsok, Ahrens et al. (2023) suggest that UMP does not decrease the tail risk in stock and bond markets outside the cycles of FOMC press releases, directly contradicting the findings of Hattori, Schrimpf, and Sushko (2016).
This paper is a first attempt to examine the relationship between monetary policy and currency tail risk in detail and contribute to the expanding body of literature that studies the relationship between central bank instruments and (tail) risk in a global context (see, for example, Ahrens et al., 2023 and the references therein).
This set was built by collecting individual daily central bank communications for each of the categories above, e.g. asset purchase or swap line or collateral eligibility change or fund provisioning announcement date, as well as major speeches (at Director or Governor level) either announcing one of the above policy interventions, or signalling its intentions in relation to monetary policy or liquidity provision stance.1
To get a better sense for the historical record across the toolkit, the following figures depict their individual implementation over time. Figure 1 shows the movement in the base rate across time and currencies. The difference in rates across jurisdictions has got smaller since the Global Financial Crisis. Figure 2 illustrates the number of times a particular policy measure has been implemented across time and currencies. The figure is a structured scatter plot so the intensity in colour represents the frequency a measure has been implemented at a particular point in time.
Figure 1: Conventional Monetary Policy Measures over Time
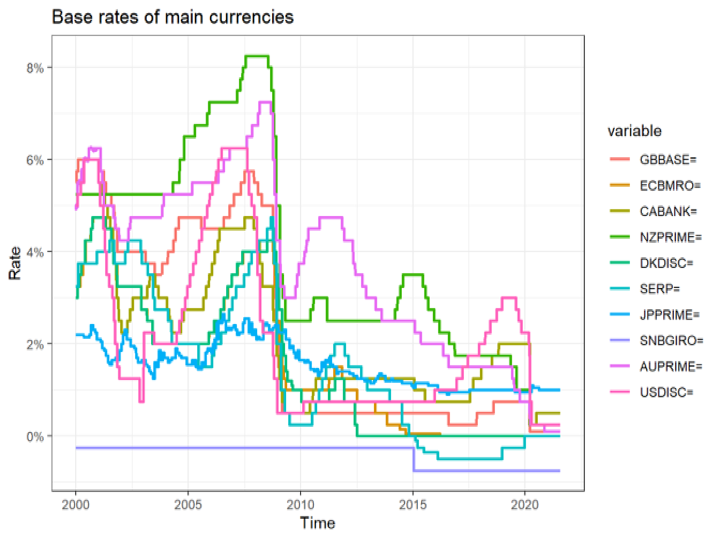
This figure shows the movement in the base interest rate controlled by the respective main central banks over the sample period from January 2000 to February 2021. These base rates pertain to the following currencies: GBP, EUR, CAD, NZD, DKK, SEK, JPY, AUD and USD.
Figure 2: Non-Traditional Measures over Time
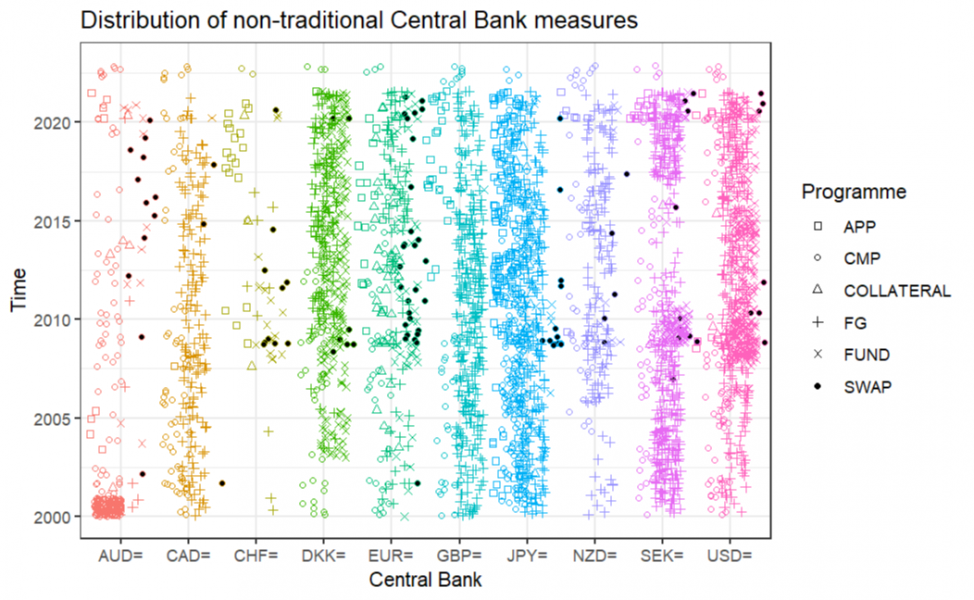
This figure shows the number of times a particular measure has been implemented over the sample period from January 2000 to February 2021. The currencies are: GBP, EUR, CAD, NZD, DKK, SEK, JPY, AUD and USD. The figure is a structured scatter plot where the intensity of colour represents the frequency the respective central bank has intervened with monetary policy measures implemented during that particular period.
Extraction of monetary policy surprises. We use future-implied yields from representative points of the yield curve, specifically for maturities of: 1 month, 2 months, 2 years, 5 years and 10 years, to capture different horizons of the yield curve. We proxy the intensity of CMP or NTM decisions as the daily change of future-implied yields, given a particular maturity, at the decision day and the following three working days.
The data, obtained from Reuters Eikon, covers the period from 2 January 2000 to 28 February 2021, yielding 5520 daily observations for each currency. We calculate the excess returns of a currency, which we use for tail risk construction, as the difference between the change in spot and forward rates.
To decompose tail risk, we account for systematic risk with a factor asset pricing model. The benchmark we employ is a three-factor model where the factors are the first three principal components estimated from a large basket of 20 USD-denominated currencies.2 After having estimated the currency systematic risk factors, we turn the focus to G7 plus AUD, NZD, CHF, DKK, SEK to model tail risk. Some of these economies did not face the constraints of the zero lower bound for interest rates and as a result did not resort to unconventional monetary policy, continuing instead to rely on conventional monetary policy. Estimating these measures in a rolling window of 250 observations with an exponentially weighted moving average, we obtain time-varying measures of tail risk shown in Figure 3.
Figure 3: Currency Tail Risk Measures over Time
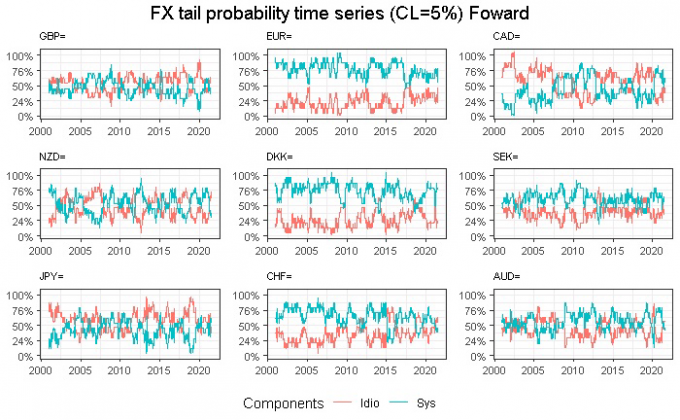
This figure shows the decomposition of currency tail risk into the systematic tail risk and idiosyncratic tail risk measures
The tail risk measures are persistent and vary widely over time. The systematic tail risk is generally the largest component of tail risk although there are instances when its prominence is more subdued. Idiosyncratic tail risk on the other hand is smaller although there are instances where it dominates the systematic component, for example, in the case of JPY.
The panel contains data from the central banks of Australia, Canada, Switzerland, Japan, U.K., Euro Area, New Zealand and Sweden. We use information from the Fed as a common control for the remaining countries. The sample covers the period from January 2000 until February 2021, at daily frequency.
Concretely, we are interested in measuring the impact of conventional monetary policy measures and NTM, i.e. NTM = {APP, Coll, FG, Fund, Swap}, on country’s currency tail risk, or any of its components. We proxy conventional monetary policy decisions and NTM as the daily change of the futures-implied yield of country, given a sovereign bond with short-term maturity.3 We also include dummy variables for the zero lower bound, and for three types of forward guidance highlighted by the literature (e.g. Ehrmann et al. (2019) and Beck, Duca, and Stracca (2019)), one that conditions on the state of the economy (FGsg), another that conditions on the calendar day (FGtg) and a third that conditions on qualitative statements (FGog). Finally, we also control for the U.S. CMP and NTM.
Results. Figure 4 presents our main takeaway. The results suggest that while the CMP has no detectable impact on the tail risk of currencies, the NTM increases the systematic component of currency tail risk. Breaking down NTM into its various components, APP and SWAP have a considerable impact and although with opposite signs, APP appears to have a stronger statistical significance while Swaps show a larger magnitude. We further observe that the dummy for FGog is statistically significant and has a similar impact as APP. Noticeably, FGog is a type of forward guidance based on qualitative statements, rather than conditioning on the state of the economy or an exogenous time period.
Figure 4: Impact on Systematic Component of Tail Risk
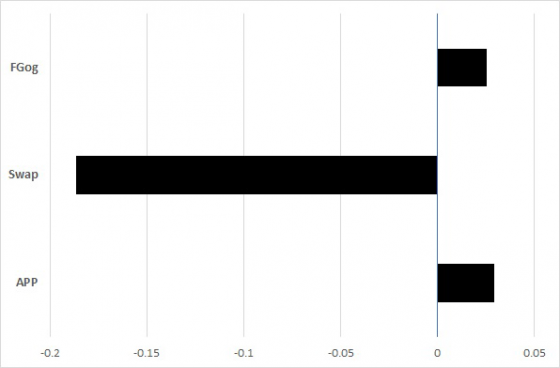
This figure reports the impact of central bank measures on the FX tail risk (systematic component). APP refers to Asset Purchase Program-mes (QE), Swap are central bank swap lines, and FGog is forward guidance based on qualitative statements. All are statistically significant at 95%.
We turn to the time series analysis using Bayesian Global Vector AutoRegressive (BGVAR) model. This method complements the panel data analysis in three ways. First, the panel data does not include cross-section general equilibrium effects. Second, using this framework we are able to depict the dynamic evolution of the transmission of central bank measures, in particular how long it lasts, when peaks occur and whether there is any cross-country heterogeneity. Third, we are able to isolate the global from the domestic effects.
For this analysis, we use information on monetary policy measures from the central banks of Canada, Switzerland, Japan, U.K., Euro Area, New Zealand and the U.S.4 The matrix of endogenous variables includes three variables for each currency: the tail risk or its systematic component, conventional (CMP) and non-traditional measure (NTM).
In order to keep the BGVAR analysis consistent with the panel analysis, we treat the U.S. Fed’s (CMP and NTM) policy actions as well as their components as exogenous variables in relation to other currencies. We model the U.S. data independently as in Mohaddes and Raissi (2019).
Identification. To identify the shocks, we impose three sign restrictions. First, using inference from our panel analysis, for each country we impose a five-days increase in the systematic component following a policy event. Second, for each country we impose a one-day zero impact on CMP. This assumption reflects the fact that before the Global Financial Crisis, there was effectively no response of policy rates to NTM while afterwards, they were bound by the ZLB. Third, using insights from the literature, we assume that NTM or APP from EUR, UK and Japan decreases the systematic component of tail risk of the other two countries (see, for example, Sosvilla-Rivero and Fernandez, 2016; Inoue and Rossi, 2019; Tran and Pham, 2020). However, we make no assumption about the impact of UK, Eurozone or Japan over Switzerland, Canada and New Zealand. For the global shock, we only assume a one-day positive effect for all countries.
Results. We find that the systematic tail component increases consistently across all currencies. The response peaks at around one week and fades out between three to four weeks after the shock. This further confirms our panel analysis results that NTM has a short-term effect. It seems the effect is strongest for CAD and JPY while weakest for CHF. Yet, for CAD, the confidence intervals are also the widest, which points to considerable uncertainty regarding the true value. Considering the (central) Bank of Canada has employed a limited number of unconventional policy measures, the wide interval is not surprising.5
To better understand the cross-border spill-overs of domestic shocks, a good proxy for the currency ties, we run a number of counterfactual exercises whereby we sequentially introduce shocks. We begin with different combinations of two shocks and gradually add one more and observe the impact on the IRFs. The difference in IRFs should capture the international transmission of that particular unconventional policy instrument.
In all cases, the entire 95% empirical distribution of the IRF is above or below 0. Moreover, the impact is persistent, both in the positive and negative territory. Following the positive domestic NTM shock, the response remains positive for about 4-5 weeks, and the peak is at around 1 and 3 weeks. The infimum of this interval represents the jurisdictions where a domestic shock has been applied, meanwhile the supremum is for jurisdictions that have imported the effects. Also, the reversal is weaker and occurs later for the jurisdictions that import the shock. This indicates a delay or friction in the cross-border transmission of shocks.
Adding more shocks does not change the dynamics. Even more, given a global NTM shock, the overall response functions are much much smaller. Yet the IRFs are significant and persistent for 1 week or longer. The largest and most persistent response is on the Swiss franc, that remains above 0 for almost 4 weeks. This implies that the Swiss franc is the most exposed to US monetary policy, followed by Japan and Canada.
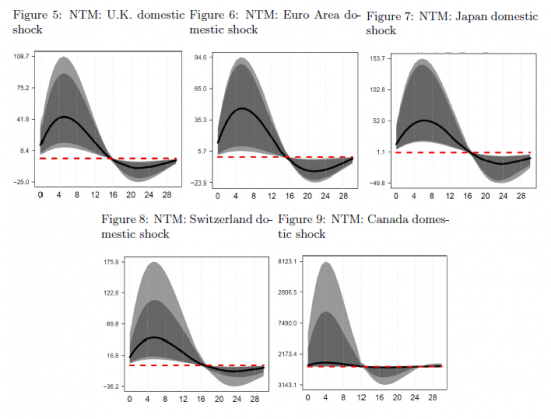
The solid line is the median response, the dark (light) grey shaded area are the 68% (95%) confidence intervals.
In this paper, we examine the relationship between central bank policy toolbox and the tail risk of exchange rates. We find that both conventional and unconventional policy tools have an impact on the tail risk – particularly the systematic component – of currencies. Moreover, the effects are stronger for countries that have more forcefully engaged in unconventional monetary policy, shedding new light on the (unintended) consequences of non-traditional measures on financial markets. The effects last for up to 1 month, and are proportionally higher for joint QE actions. This suggests a reinforcement of monetary policy effects. Our empirical analysis confirms the existence of a financial cross-border transmission channel of central bank policy, via the FX market.
Baumgartner, J., Ahrens, Maximilian et al. (2023). “Mind Your Language: Market Responses to Central Bank Speeches”. In: Available at SSRN 4471242.
Beck, Roland, Ioana Duca, and Livio Stracca (2019). “Medium term treatment and side effects of quantitative easing: international evidence”. In: ECB Working Paper.
Bruno, Valentina and Hyun Song Shin (2015). “Capital flows and the risk-taking channel of monetary policy”. In: Journal of Monetary Economics 71, pp. 119–132.
Ehrmann, Michael et al. (2019). “Can more public information raise uncertainty? The international evidence on forward guidance”. In: Journal of Monetary Economics 108, pp. 93–112.
Feldkircher, Martin and Florian Huber (2016). “The international transmission of US shocks—Evidence from Bayesian global vector autoregressions”. In: European Economic Review 81, pp. 167–188.
Ferrari, Massimo, Jonathan Kearns, and Andreas Schrimpf (2021). “Monetary policy’s rising FX impact in the era of ultra-low rates”. In: Journal of Banking & Finance 129, p. 106142.
Gambacorta, Leonardo, Boris Hofmann, and Gert Peersman (2012). “Effectiveness of Unconventional Monetary Policy at the Zero Lower Bound”. In: 2012 Meeting Papers. 400. Society for Economic Dynamics.
Hattori, Masazumi, Andreas Schrimpf, and Vladyslav Sushko (2016). “The response of tail risk perceptions to unconventional monetary policy”. In: American Economic Journal: Macroeconomics 8.2, pp. 111–36.
Inoue, Atsushi and Barbara Rossi (2019). “The effects of conventional and unconventional monetary policy on exchange rates”. In: Journal of International Economics 118, pp. 419–447.
Kearns, Jonathan and Phil Manners (2018). “The impact of monetary policy on the exchange rate: A study using intraday data”. In: Seventh issue (December 2006) of the International Journal of Central Banking.
Mohaddes, Kamiar and Mehdi Raissi (2019). “The US oil supply revolution and the global economy”. In: Empirical Economics 57, pp. 1515–1546.
Rogers, John H, Chiara Scotti, and Jonathan H Wright (2014). “Evaluating asset-market effects of unconventional monetary policy: a multi-country review”. In: Economic Policy 29.80, pp. 749–799.
— (2018). “Unconventional monetary policy and international risk premia”. In: Journal of Money, Credit and Banking 50.8, pp. 1827–1850.
Sosvilla-Rivero, Simon and Natalia Fernandez (2016). “Unconventional monetary policy and the dollar–euro exchange rate: further evidence from event studies”. In: Applied Economics Letters 23.12, pp. 835–839.
Swanson, Eric T. (2021). “Measuring the effects of Federal Reserve forward guidance and asset purchases on financial markets”. In: Journal of Monetary Economics 118, pp. 32– 53.
Tran, Thi Bich Ngoc and Hoang Cam Huong Pham (2020). “The spillover effects of the us unconventional monetary policy: New evidence from asian developing countries”. In: Journal of Risk and Financial Management 13.8, p. 165.
The data is publicly availabe at www.ccanon.net.
These currencies are: GBP, EUR, CAD, NZD, DKK, SEK, JPY, CHF, AUD, MXN, ARS, IDR, RUB, ZAR, INR, TRY, BRL, CNY, KRW, SAR.
Here we present the results with a two months bonds, but in the paper we also analyze 1 mont, 2 years, 5 years and 10 years. We incorporate the triple interaction of month, year and country fixed effects to control for unobserved time-varying confounding effects for each country. These fixed-effects should help to incorporate time-varying country-level determinants that are difficult to include given our analysis uses daily (or weekly) frequency. The main econometric challenge is a potential endogeneity across FX market, in particular the joint occurrence of tail events and monetary policy decisions. We follow an instrumental variable approach to correct for this. The identifying assumption we use is that medium and long-term implied yield changes do shape currency tail risk but only through its impact on the front end of the curve.
We have omitted Sweden and Denmark for model dimensionality issues. Moreover, their currencies follow closely the dynamics of EURO, so we don’t expect it to be structurally different from the Euro Area. We use the weighting matrix of Feldkircher and Huber (2016) whose estimates are based on the annual bilateral trade flows including services, averaged over the period 2000-2012 which largely overlaps with our sample.
In paper we evaluate the impact of APPs. The results are qualitatively similar to those of NTM, although the responses seem somewhat more persistent.