The past two decades have been marked by renewed optimism for Africa with several countries in the region enjoying high growth rates. Ranking high amongst the many positive factors (rapid urbanization, a growing middle class, etc.), is Africa’s increasing trade and financial integration with the rest of the world. All types of funding (foreign investment, bank financing, etc.) have risen rapidly since the mid-2000’s. However, the economic performance in terms of productivity catch-up with more developed markets has yet to materialise, and the continent still falls well short of its full growth potential. To reach this, a higher investment rate and more diversified FDI across sectors are key in shaping a more balanced and resilient growth model, less focused on just a few pockets of growth (such as extractive industries and trade hubs). This new pattern should prioritize agriculture, further diversification of export revenues and more inclusive finance to gradually attract a larger share of the rural activity into the formal sector.
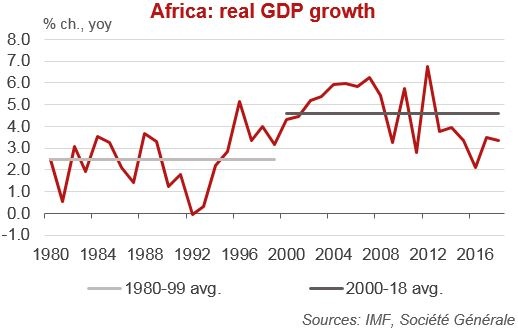
Over the past two decades, the overall sentiment on Africa turned from “Afro-pessimism” in the 80’s and the 90’s, to various shades of “Afro-optimism” since the beginning of the 2000’s. This shift reflects the acceleration of annual growth rates in the region: up from around 2.5% in the 80’s and 90’s, to 5% in the 2000’s and 4% since 2010. With the exception of Asia, African markets have been among the strongest and most resilient over the past two decades.
Figure 1.
One often-cited illustration of this shift is the changing front page covers of The Economist on the region; “The hopeless continent” in 2000, “Africa rising” in 2011, followed by an upbeat “Aspiring Africa” in 2013. Still on an anecdotal level, by the turn of the 2010’s, Africa appeared as an anchor theme for several private companies, as illustrated by McKinsey publishing its “Lions on the move” seminal report in 2010.
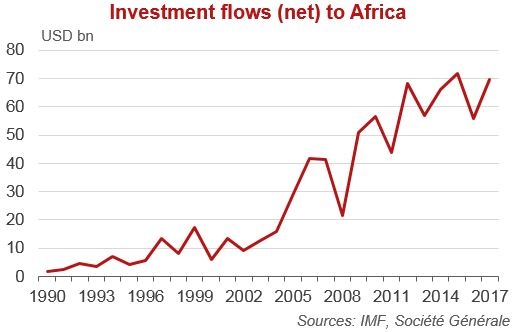
The acceleration in regional growth has been fuelled by global trade and financial integration, as Africa started to attract higher financial flows. Foreign direct investments – FDI – and portfolio investments increased only marginally on net terms during the 1990’s, from USD 2bn in 1990 to USD 13bn in 2003, but then took off in 2004 and have averaged approximately USD 65bn per year since 2012. The geographical distribution of these private investment flows also tends to be more balanced than in the past: while resource-intensive countries used to receive the bulk of investment flows, the share of smaller, poorer or non-resource countries has been increasing over the last decade.
Figure 2.
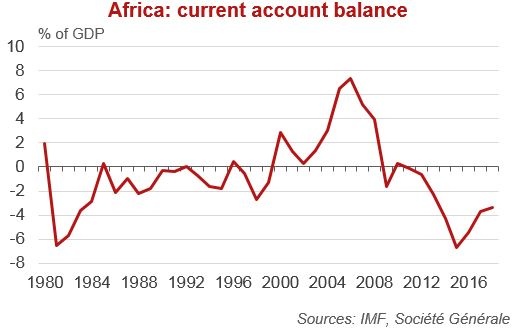
On the flip side of this reality, the continent’s current account deficit started to become more “volatile” when growth accelerated, registering large surpluses when commodity prices were high, in particular oil, and – conversely – important deficits when oil prices declined. African countries remain exposed to cycles in primary commodity prices because, being less industrialized, they are sensitive to the price of their commodity exports, and also because food is a greater share of their domestic consumption.
Figure 3.
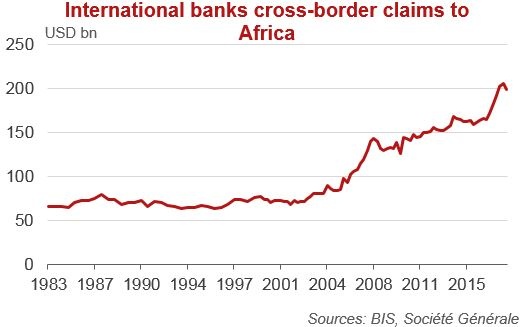
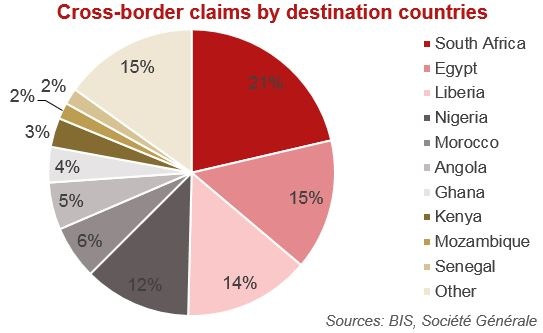
Further reflecting this greater integration is the development of banking intermediation across the continent, both on “international” and “domestic” terms. BIS-reporting banks’ exposure to the continent has risen significantly since Africa took off, with the stock of international claims (cross-border claims plus local claims in foreign currencies) on African counterparties jumping from around USD 75bn in 2000 to close to USD 200bn in 2018. This trend has proven surprisingly resilient so far, being only slightly dented by adverse events such as the global financial crisis, followed by the sharp tightening of compliance rules worldwide, or by changes in international banks’ strategies, pulling back from Africa.
Figure 4.
International banks exposure to Africa is relatively balanced among countries with the major economies hosting the largest exposures. Liberia’s status as a flag of convenience explains why the country accounts for almost 15% of the stock of international claims; Algeria’s policies aimed at “self-reliance” explain the sharp decrease in the country’s share of international banks’ exposure (from more than 20% of the total stock in 1990 to less than 1% currently).
Figure 5.
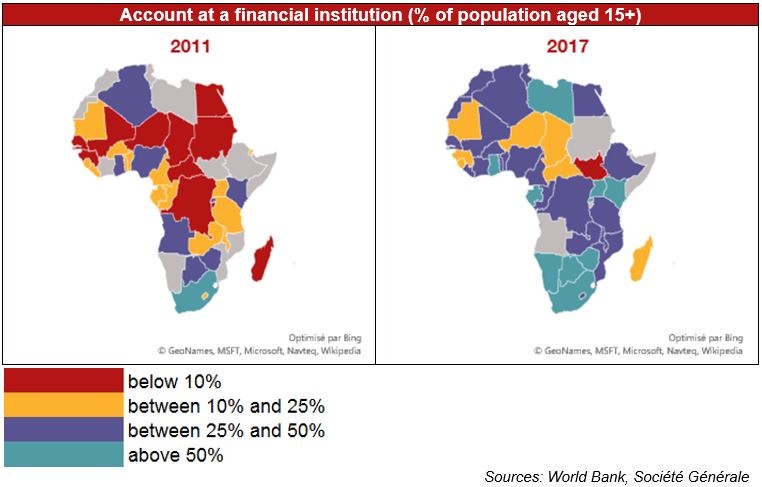
Banking intermediation has also significantly progressed on the domestic level, sometimes with the participation of international banks. Both credit intermediation (credit to the private sector as % of GDP) and financial inclusion (% of adults having an account at a formal financial institution) have regularly increased in the region over the past decade. Moreover, Africa has been on the forefront of innovative ways to “bank” its population, such as mobile banking or micro-finance.
Figure 6.
Africa’s population is growing fast and has started a demographic transition. Within the coming decades it is expected to register the benefits of a more favourable demographic structure, with the working age population growing faster than the total population thus pushing down dependency ratios. However, most sub-Saharan countries are still at the very early stages of this demographic transition, which also appears to be slow when compared to past trajectories of Asia or Latin America. The population is expected by the United Nations to be growing by more than 2% per annum at least until 2050.
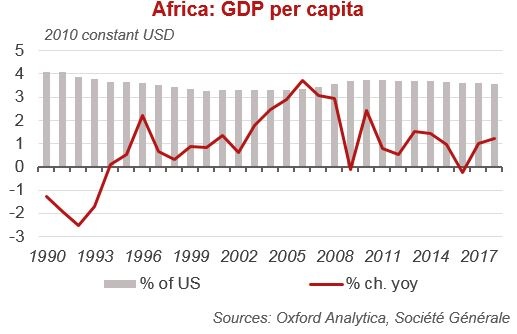
As a result, the impact of this demographic dividend has to date been low in terms of GDP per capita. Africa’s “take-off” has translated in relatively meagre increases in real GDP per capita, below 3% per annum since 1990 except for a brief period in in 2006 and 2007. In terms of catch up with mature markets, it is hardly noticeable. Africa’s GDP per capita has remained broadly stable, as a percentage of the US level, over the past 30 years, because of the combination of growth in the US and of a structural depreciation trend of African currencies fuelled by recurrent current account deficits.
Figure 7.
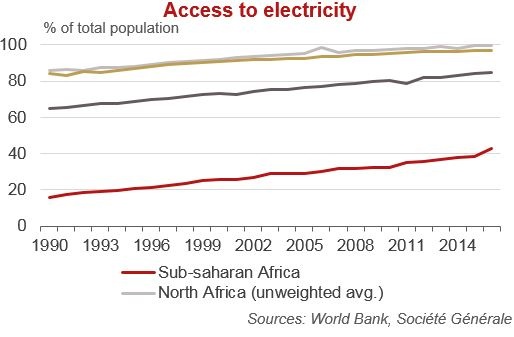
Raising investment rates is therefore key to increase the growth potential. The levels of investment as a % of GDP have remained significantly below those of Emerging Asia and barely in line with those registered in Latin America or Emerging Europe. This is a significant drag on growth, considering also that the level and quality of infrastructure is lagging far behind other regions, particularly in Sub-Saharan Africa.
Figure 8.
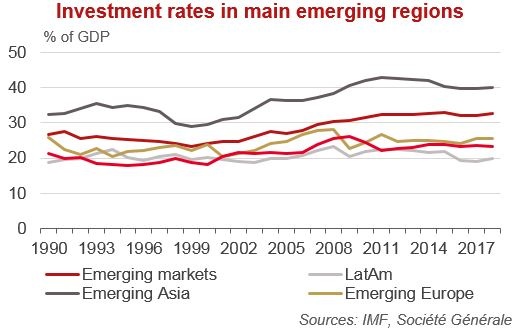
Figure 9.
In terms of potential “catch-up” with more mature markets, the outlook remains thus heterogenous among but also within countries. Much hope is being put in the combination of more business-friendly policies and new technologies to solve the infrastructure bottlenecks. This could ensure leapfrogging for the more productive and inclusive clusters of growth. Conversely, and depending on the quality of their governance, other regions and countries could be stuck in a standstill if they do not attract the right kind of productivity enhancing investments.
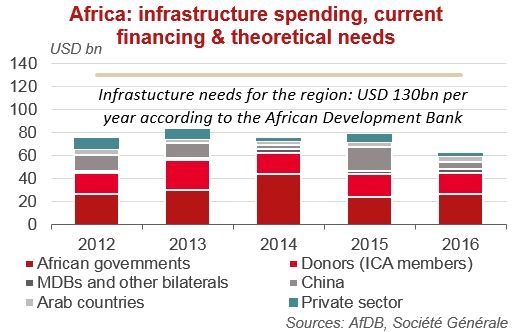
Raising investment rates is a difficult task, as the region remains constrained by low levels of domestic savings. Most institutions foresee that external financing needs will remain important in Africa over the coming years. According to Oxford Analytica, Africa is expected to register an average aggregated balance of payments deficit of 5.1% of GDP in the next 10 years. This would represent more than USD 100bn to finance every year. The African Development Bank recently estimated the continent’s infrastructure needs at USD 130–170bn a year2, with an annual financing gap in the range of USD 68–108bn.
Figure 10.
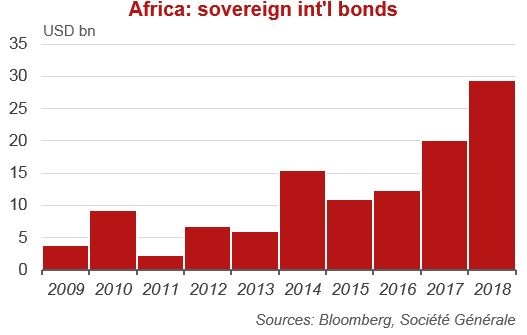
In addition to the level of investment, composition will be key. Africa has financed its growth in the last decade with higher debt flows, but productive investment is lagging. The share of portfolio flows in total investment flows has increased. Portfolio inflows to Africa were near zero in net terms until 2009; they now account for around a third of total flows. With the low development of equity markets (except in South Africa) these flows essentially mirror the issuance of international debt bonds, adding a new component to the external solvency constraint in the region. Solvency ratios have worsened on average since the early 2010’s after the debt cancellations under MDRI and HIPC initiatives. Higher reliance on more costly resources such as bonds and commercial credits has increased debt services, in particular in low and middle-income countries of Sub-Saharan Africa.
Table 1.
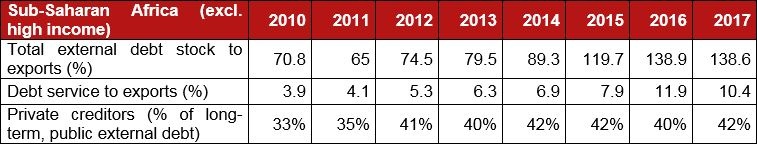
Figure 11.
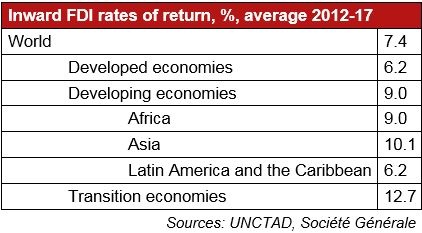
While increasing during the first phase of the “Africa growth story” between 2004 and 2008, FDI flows have remained broadly stable since, hovering around USD 40 to 50bn per year according to UNCTAD statistics, and accounting for around two-thirds of total investment flows since 2010. Africa accounts for approximately 3% to 4% of the world’s total FDI, fairly much the same share as in 2001, and broadly comparable with Africa’s share of the world GDP. This could be viewed an underperformance as the region should theoretically be able to attract a bigger share of total FDI, considering its infrastructure needs, its globally improving macroeconomic performance, or the fact that rates on return on FDI tend to be higher than in other emerging or developed markets.
Figure 12.
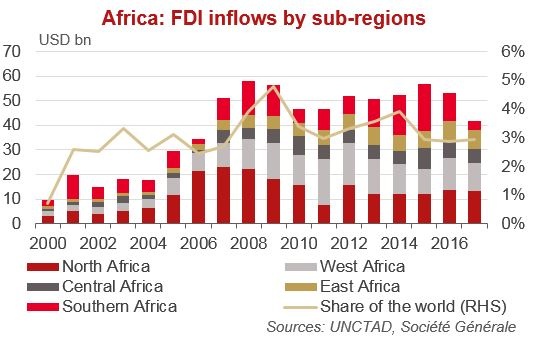
Table 2.
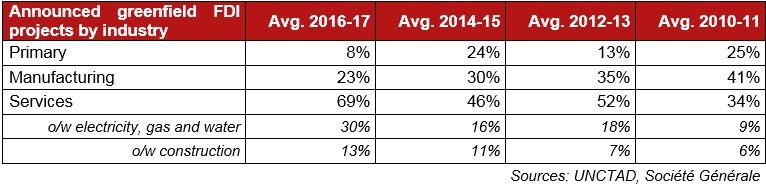
The picture is also mixed when analysing the recipient sectors. The share of manufacturing in greenfield projects (greenfield projects account for the lion’s share of FDI in Africa, while M&A deals remain marginal) has been decreasing over the past years, from 41% in 2010-11 to only 23% in 2016-17. On a more optimistic side, the share of “infrastructure” investments – defined as the combination of electricity, gas, water and construction subsections – has increased strongly, and they account now for more than 40% of greenfield projects.
Table 3.
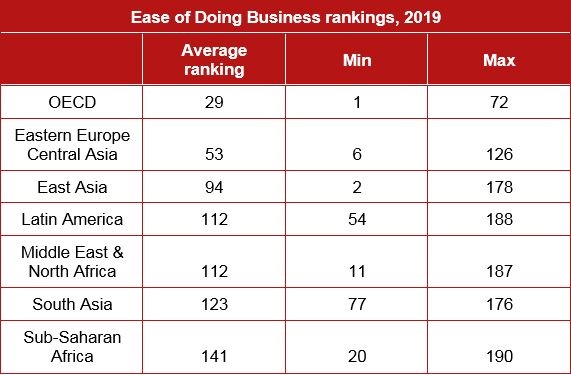
Reasons for the stagnating levels of FDI are difficult to list. However, most studies point towards institutional quality as a key “pull factor” for FDI. While many countries have made real progress in terms of economic and political governance, the region continues to lag behind other emerging regions in most international rankings (World Bank’s “Governance Indicators” or “Ease of Doing Business”; World Economic Forum’s “Global Competitiveness Report”). Investors continue to perceive Africa as the riskiest region in the world, with rates of return potentially not high enough to compensate for this risk. There are however growing differences between countries. Non-resources countries display on average improving economic and political governance indicators, while this is not true on average for “rentier” countries.
Table 4.
Overall, underperformance in terms of levels and sectoral allocation of FDI seems to have contributed at least partly to poor productivity performance for the continent, highlighting some key question marks on Africa’s “growth story”.
Africa’s transformation process differs from other regional transformations in several ways. Many people continue to live in rural areas and depend on agriculture. The industrial sector is still underdeveloped, especially manufacturing industry, and structural change out of agricultural employment remains limited. Lessons from the experiences of other emerging economies point that the role of agriculture as a catalyst for broader economic transformation remains crucial.
Despite a strong potential, with the continent hosting 60% of the world’s uncultivated arable land, progress in terms of agricultural output has been extremely slow. Much of the sector remains stuck into “subsistence farming” with small farms, unsecure land rights, lack of storage facilities and a poor ability to market crops. On average for the continent, gross agriculture output per capita levels have remained broadly stable since the days of independence. One exception is East Africa, which has more successfully developed export-oriented crops, besides a large traditional subsistence farming sector. This lack of comprehensive green revolution in the continent explains the need to massively import food for the large cities. It does also explain the high “hunger” levels. The World Bank estimates the “food deficit” in Sub-Saharan Africa at around 130 kilo calories per person per day, twice the level in East Asia.
Figure 13.
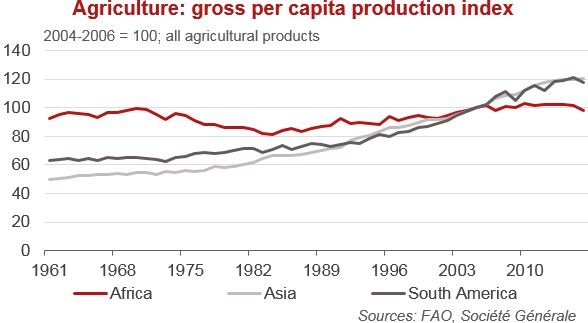
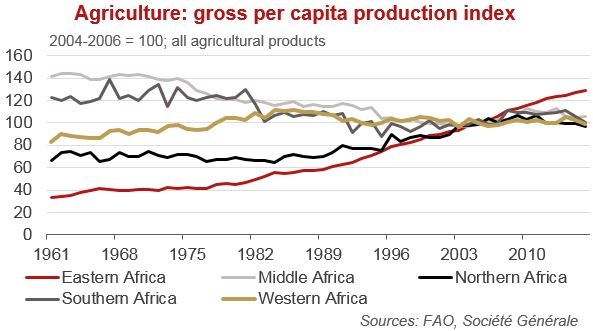
Note: Per caput index obtained by dividing “Production Index” numbers by index of population, or directly from per caput production
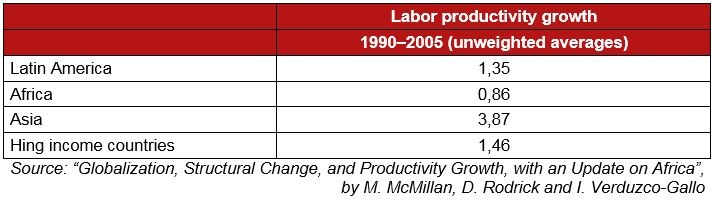
With scarce data available on productivity levels across regions and periods, it nevertheless seems that African productivity has not progressed as it should have during times of high growth, pointing also towards “pockets” of growth not evenly distributed within countries. Available studies (such “Globalization, Structural Change, and Productivity Growth, with an Update on Africa” by M. McMillan, D. Rodrick and I. Verduzco-Gallo) suggest that labour productivity growth in Africa has evolved much more slowly than in other emerging regions.
Table 5.
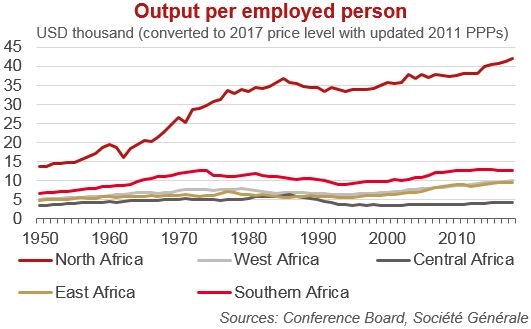
The same trend can be seen in the level of output per employed person as estimated by the Conference Board, where Africa now clearly lags other regions. The only sub-region registering a significant increase in this productivity proxy is North Africa, where the share of manufacturing in the economy has remained stable over the past three decades, around 15 to 20% of GDP. In Sub-Saharan Africa, the share of manufacturing industry has decreased from close to 18% in 1990 to less than 10% currently. This could be one among many other factors, such as education and health issues, that have been weighing on the evolution of productivity.
Figure 14.
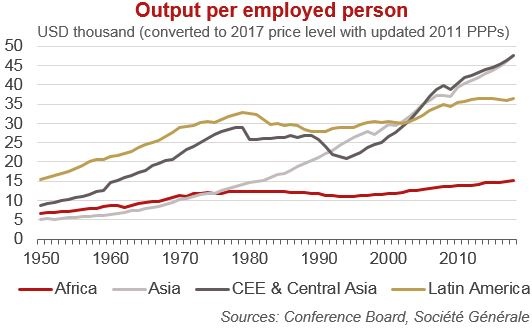
Notes: Real GDP is expressed in 2016 PPP $ […]. The 2016 PPPs are based on the World Bank-international comparison project (ICP) 2011
round, updated using the change in the national GDP deflator, relative to the US GDP deflator.
Estimates of labour productivity based on GDP per person employed are available for all countries in the database. While this is a relatively
robust measure, it does not correct for part-time jobs as it merely counts people who are employed. Hence, GDP per person employed is
somewhat underestimated in countries with a higher share of part-time workers, which are mostly OECD countries.
Recovery of economic activity through the continent is likely to continue in the coming years. A combination of greater economic diversification, ongoing sub-regional integration, new hydrocarbon production coming on line and more favourable business environments will offer tailwinds. However, the high sensitivity to commodity price, the rapidly growing population and the rising external debt burden and will also continue to pose persistent challenges.
Africa needs to attract more FDI to further diversify its export revenues and to enhance its productivity levels. Building resilient energy infrastructure, establishing manufacturing hubs, redesigning urban development and broadening the ability to raise fiscal revenues are recognized priorities to achieve these goals. Otherwise, the external balance of payment constraint is likely to bite again sooner or later.
Beyond this agenda, the need to develop policies and new business models to better integrate the very large informal sector, especially in agriculture, is a parallel priority of equal importance and urgency. With the slow demographic transition, rural communities will continue to grow significantly, even if their share in the total population is declining. This will further adjourn the prospect of reaching a “Lewis point” in the development trajectory. The Lewis turning point, named after the development economist and Nobel prize laureate Arthur Lewis, is when surplus rural labour is reduced to zero, pulling upwards agricultural and unskilled industrial real wages. For the years ahead in Sub-Saharan Africa, a large segment of the population could remain trapped in the rural communities with informal and low productivity activity if polices, new business models, and more inclusive finance fail to attract gradually this population in the formal sector.
African Development Bank, African Economic Outlook 2018.
Antil A. (2018), „Afrique subsaharienne: la mondialisation par le bas“, Ramses 2018.
Dorin B., Hourcade J.-C. and M. Benoit-Cattin (2013), „A World Without Farmers? The Lewis Path Revisited”, CIRED Working papers No 47-2013.
McMillan M., D. Rodrick and I. Verduzco-Gallo (2014), „Globalization, Structural Change, and Productivity Growth, with an Update on Africa“, World Development Vol. 63, pp. 11–32, Elsevier Ltd.
OECD Development Centre, Policy note on Africa “Betting on a growing market”, October 2015.
OECD Development Centre, Policy note on Africa “Investing in growing African cities”, September 2016 .
The Conference Board (2018), Total Economy Database™ (Adjusted version).
UNCTAD, World Investment Report 2018.
Olivier de Boysson, Chief Economist Emerging Markets, Société Générale; Clément Gillet, Senior Economist – Africa, Société Générale.
The African Development Bank released this new estimate in their African Economic Outlook 2018. Investment needs were estimated on subsectors, with targets to be achieved by 2025: