An analysis of the research literature shows that the average effects of central bank balance sheet policies on output and inflation are positive, that is, output and inflation increase when the central bank extends its asset purchases. Reviewing the estimated effects of the balance sheet policies conducted in the euro area, the United States and the United Kingdom on economic developments, Fabo et al. (2020) find that the effects are on average two to three times greater in the United States than in the euro area and the United Kingdom. However, there are significant variations in the effects measured in different studies.
This analysis shows that the differences in the effects of balance sheet policies across countries are not as large when we divide the studies according to which method was used or where they were published (in scientific journals or as working papers). The differences across countries seem to some extent explained by the selection of studies for the respective country.
Central bank balance sheet policies consist of measures that affect the size of the central bank balance sheet. They have been used by many central banks in a situation where the policy rate began to approach a possible lower bound.2 The measures can be expected to affect market rates, which in turn affect output, inflation and employment, for instance. How can we then know how effective these measures are? One means of addressing this question is to summarize earlier empirical studies.3 There is a large degree of consensus in the literature on the effects of conventional monetary policy on the economy (see, for instance, Ramey, 2016). On the other hand, the effects of quantitative easing are more uncertain. This is partly because such measures have been carried out under a limited period of time.
In their meta-analysis, Fabo et al. (2020) review the effects reported in the research literature of the balance sheet policies implemented in the euro area, the United States and the United Kingdom on economic conditions. The effects can differ across countries, partly as a result of the different monetary policy frameworks, the way the financial markets function or the way the central banks have designed their purchase programmes. The authors show that the effects are on average positive with regard to output and inflation, and greater in the United States than in the euro area and the United Kingdom. They focus on the differences in the results, depending on whether the studies were conducted by researchers at central banks or other institutions.
This analysis divides the material differently. We show that the effects of quantitative easing vary, depending on which method is used and on whether the study has been published as a working paper or in a scientific journal.4 When we use these divisions, the differences in effects across countries are small, once outliers are excluded.
We use a collection of the effects of balance sheet policies from studies conducted on data for the euro area, the United States and the United Kingdom, which have been published as working papers or in scientific journals up to 2019, see Fabo et al. (2020). The central bank balance sheet policies involve purchases of government bonds and corporate and mortgage bonds, as well as loans to the banks and targeted long-term repo operations (LTRO). The data covers the balance sheet policies used during and after the financial crisis, as well as the measures used in the euro area between the years 2014 and 2018, with the aim of making monetary policy more expansionary.
To be able to compare the studies, we examine the effects of asset purchases that correspond to one per cent of GDP.5 In total, we refer to 48 empirical studies that have been published up to the end of 2019. The studies report the effects on output and inflation.6 All in all, the studies provide 58 observed effects on output and 53 on inflation, as some of the studies cover data for several countries. We chose to study the peak effects of asset purchases on output and the cumulative effect on the price level, that is the total effect on inflation.
The methods used to derive the effects of asset purchases differ between studies. Some studies use VAR models, while other studies use DSGE models. VAR models consist of a system of relationships that describe the dynamics in the data, without necessarily being based on a clearly specified economic theory. The research literature describes several different ways of identifying the effects of balance sheet policies in VAR models and the results can vary, depending on which identification method is used.7 DSGE models are normally based on certain predetermined assumptions of the economic motives behind the behaviour of individuals and firms, and the mechanisms through which balance sheet policies affect the economy are therefore clearer.8
Before we move on to the size of the effects of balance sheet policies, it may be interesting to list the channels through which the measures can be expected to work. Central bank balance sheet policies can make monetary policy more expansionary in several different ways. The different channels can also interact with one another. It is difficult to identify the precise channel in VAR models. In DSGE models, the assumptions are based on how the channels function with regard to economic theory and are thus clearer. However, these models usually focus only on one set of the channels.
DSGE models usually focus on the premium channel or the portfolio balance channel. The relatively few studies in the literature describing the effects of measures in small open economies also include the exchange rate channel.
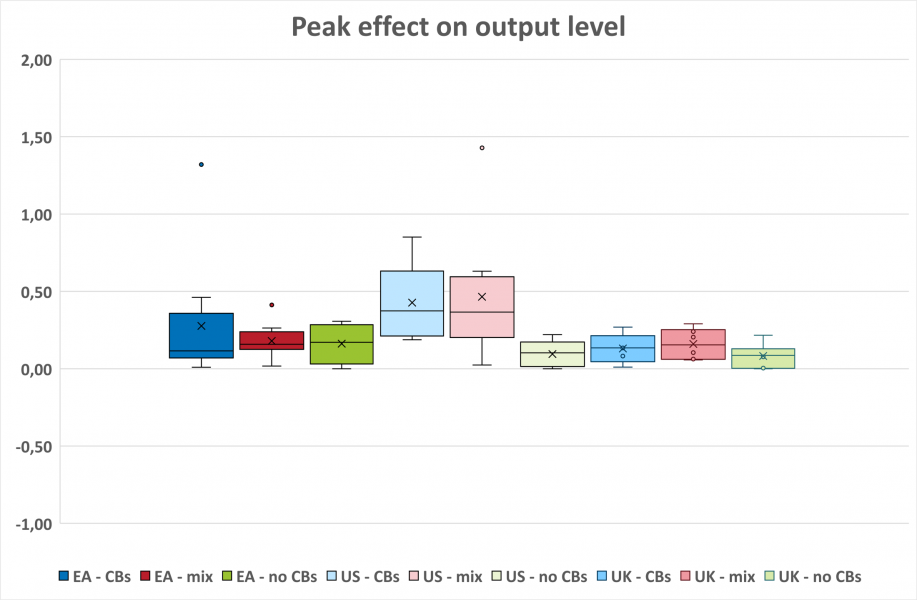
Figure 1. Peak effects of measures corresponding to one per cent of GDP on output in the euro area, United States and United Kingdom, with VAR and DSGE models respectively
Percent
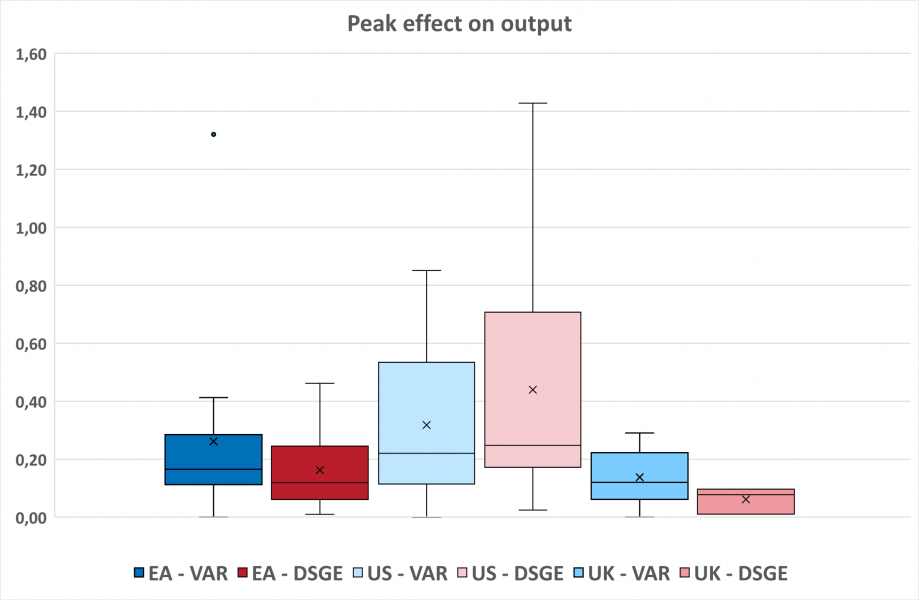
Note. There are 13 (9) studies using VAR (DSGE) models for the euro area, 13 (6) for the United States and 14 (3) for the United Kingdom. The box marks the first and third quartiles, the unbroken line and the cross inside the box marks the median and average, respectively. The vertical lines (whiskers) going out of the boxes mark the highest and lowest values of the observations not interpreted as outliers. Observations more than one and a half times the quartile distance from the box are regarded as outliers and marked with a dot.
Source: Data from Fabo et al. (2020).
4. The effects vary depending on the method used
Fabo et al. (2020) calculate that the average peak effect on output of measures corresponding to one per cent of GDP is 0.36 per cent in the United States, 0.22 per cent in the euro area and 0.12 in the United Kingdom. The average total effect on inflation of measures corresponding to one per cent of GDP is 0.21 percentage points in the United States, 0.11 in the euro area and 0.04 in the United Kingdom. The effects in the United States thus appear to be on average two to three times greater than in the euro area and the United Kingdom. One could therefore draw the conclusion, as do Fabo et al. (2020), that the measures have been more effective in the United States than in other countries. But the size of the effects also varies depending on which method is used to estimate the effects. Figures 1 and 2 show the effects for the three regions and the two methods in the form of box plots, which give a summary of the distribution of the effects among the different studies.
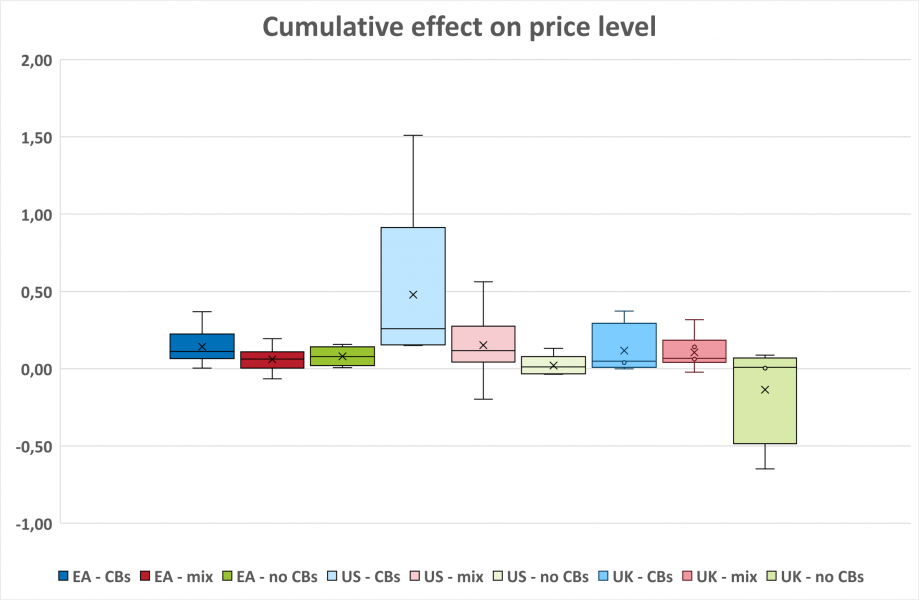
Figure 2. Maximum effects of measures corresponding to one per cent of GDP on inflation in the euro area, United States and United Kingdom, with VAR and DSGE models respectively
Percentage points
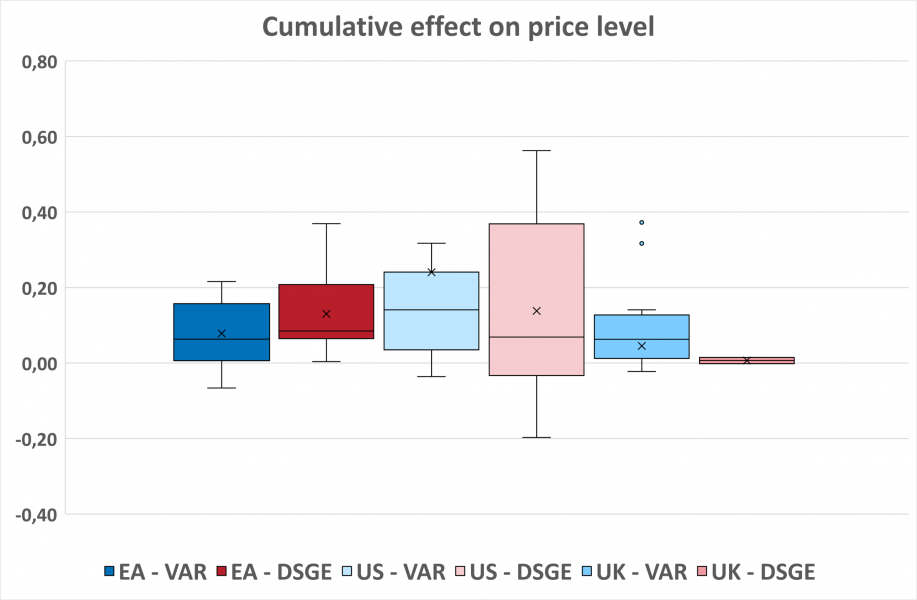
Note. There are 11 (10) studies using VAR (DSGE) models for the euro area, 12 (6) for the United States and 12 (2) for the United Kingdom. The box marks the first and third quartiles, the unbroken line and the cross inside the box mark the median and average, respectively. The vertical lines (whiskers) going out of the boxes mark the highest and lowest values of the observations not interpreted as outliers. Observations more than one and a half times the quartile distance from the box are regarded as outliers and marked with a dot. To clarify the box plot, we have removed an outlier for the United Kingdom with the VAR model (-0.65) and an outlier for the United States with the VAR model (1.51).
Source: Data from Fabo et al. (2020).
Figure 1 shows the peak effect on the level of output in the euro area, the United States and the United Kingdom, divided into those using VAR or DSGE models. The effects are overall positive. There are major differences across countries with the DSGE models and minor differences across countries with the VAR models. The variation in the effects from the DSGE models for the United States is also large, and there are few studies with DSGE models for the United Kingdom.
The effects on inflation of the different studies are illustrated in Figure 2. Most of the results are positive. A few studies find a negative effect on inflation, but one cannot determine whether this is statistically significant. In the same way as for the effects on output, the variation across countries is relatively small with VAR models. Both the largest and the smallest effect in the studies using DSGE models regard the United States, while the effects for the United Kingdom using DSGE models are roughly zero.9
Studies that are published in scientific journals are examined by experts on the subject and ought therefore to have a higher quality than working papers. One question is whether the results in scientific articles and working papers differ in any systematic manner.
Figure 3. Peak effects of measures corresponding to one per cent of GDP on output in the euro area, the United States and the United Kingdom in working papers (WP) and in studies published in scientific journals (Pub)
Per cent
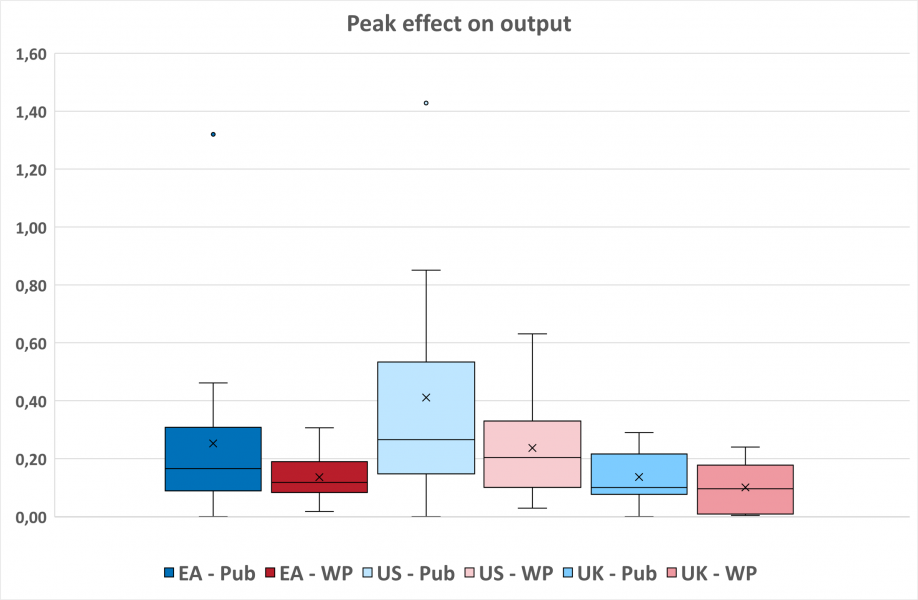
Note. There are 6 (16) studies published as WP (Pub) for the euro area, 6 (13) for the United States and 6 (11) for the United Kingdom. The box marks the first and third quartiles, the unbroken line and the cross inside the box mark the median and average, respectively. The vertical lines (whiskers) going out of the boxes mark the highest and lowest values of the observations not interpreted as outliers. Observations more than one and a half times the quartile distance from the box are regarded as outliers and marked with a dot.
Source: Data from Fabo et al. (2020).
Figure 3 shows the peak effect on the level of output in the euro area, the United States and the United Kingdom, divided into these two groups. In the United States, the average effects are more like the median effects than in Figure 1, as the study that found the largest effect is regarded as an extreme value in this division of studies.10 Unlike Figure 1, the effects for the United Kingdom are not as clearly smaller than those for the United States when one analyses each group.
The effects on inflation in the various studies are presented in Figure 4. The differences across countries are smaller than in Figure 2, both with regard to the median and the average and the effects in the United Kingdom are similar to those in the United States and the euro area.
Figure 4. Total effects of measures corresponding to one per cent of GDP on inflation in the euro area, the United States and the United Kingdom in working papers (WP) and in studies published in scientific journals (Pub)
Percentage points
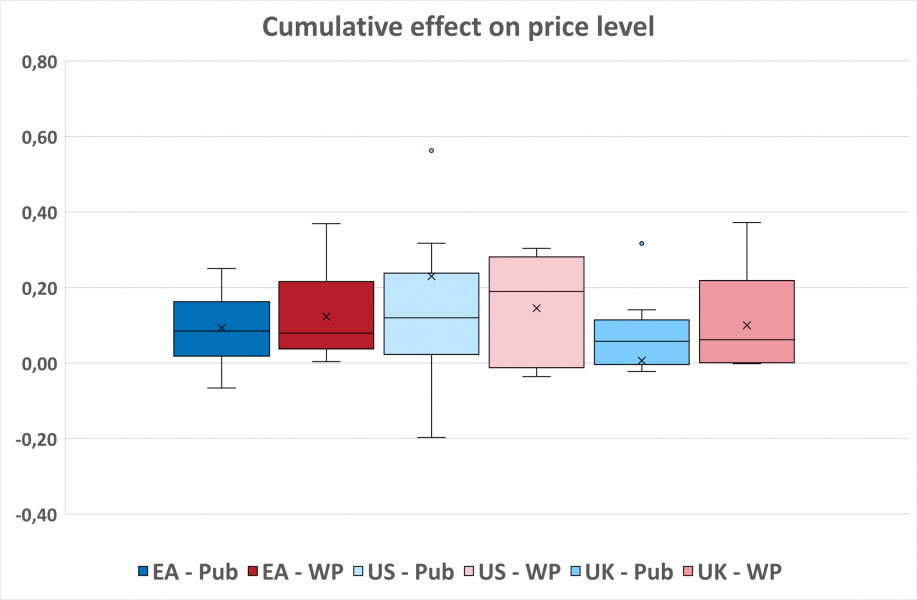
Note. There are 7 (14) studies published as WP (Pub) for the euro area, 5 (13) for the United States and 5 (9) for the United Kingdom. The box marks the first and third quartiles, the unbroken line and the cross inside the box mark the median and average, respectively. The vertical lines (whiskers) going out of the boxes mark the highest and lowest values of the observations not interpreted as outliers. Observations more than one and a half times the quartile distance from the box are regarded as outliers and marked with a dot. To make the figure easier to read, we have removed an outlier for the United States (1.51) and one for the United Kingdom (-0.65) in studies published in scientific journals.
Source: Data from Fabo et al. (2020).
It is thus not yet clear what effects balance sheet policies have on the economy, but the empirical studies reported in Fabo et al. (2020) find that balance sheet policies conducted in the euro area, the United States and the United Kingdom have largely had a positive effect on output and inflation. The average effects in the United States are two to three times greater than in the euro area and the United Kingdom if all studies are included, but the variation in the estimated effects is also greatest for the United States.
The differences in the effects of balance sheet policies across countries do not appear as large when we divide the studies according to the method used or where they were published. This implies that the differences across countries are to some extent explained by the selection of studies for the respective country.
Something important to note is that we have focused on the domestic effects of balance sheet policies. The policies adopted in the euro area, the United States and the United Kingdom may have also spillover effects on other economies, especially small open economies.11 The issue of spillovers is particularly relevant in the current Covid-19 pandemic, when many central banks around the world have started or re-started their asset purchase programmes.
Alpanda, S. and S. Kabaca (2020), “International Spillovers of Large-Scale Asset Purchases,” Journal of the European Economic Association, vol. 18(1), pp. 342‑391.
Bhattarai, S. and C. Neely (2016), “A survey of the empirical literature on US unconventional monetary policy”, Federal Reserve Bank of St. Louis, Research Division, Working Paper.
Bernanke, B. S. (2020), “The New Tools of Monetary Policy.” American Economic Review 110 (4), pp. 943-83.
Bluwstein, K. and F. Canova (2016), “Beggar-Thy-Neighbor? The International Effects of ECB Unconventional Monetary Policy Measures,” International Journal of Central Banking, September 2016, 12 (3), 69{120.
Borio, C. and A. Zabai (2016), “Unconventional Monetary Policies: a Re-Appraisal“, BIS Working Papers 570.
Carlstrom, C. T., T. S. Fuerst and M. Paustian (2017), “Targeting Long Rates in a Model with Segmented Markets,” American Economic Journal: Macroeconomics, 9 (1): 205-42.
Chen, Han, V, Cúrdia and A, Ferrero (2017), “The macroeconomic effects of large-scale asset purchase programmes”, The Economic Journal, 2012, 122 (564), F289-F315.
Chung, H., J.-P. Laforte, D. Reifschneider and J. C. Williams (2012), “Have We Underestimated the Likelihood and Severity of Zero Lower Bound Events?” Journal of Money, Credit and Banking, 44: 47-82.
CGFS (2019), “Unconventional Monetary Policy Tools: a Cross-country Analysis”, Committee on the Global Financial System Papers No 63, Bank for International Settlements.
Fabo, B., M. Jancokova, E. Kempf and L. Pastor (2020), “Fifty shades of QE: Conflicts of interest in economic research”, NBER Working Paper No. 27849.
Gertler, M. and P. Karadi (2013), “QE 1 vs. 2 vs. 3. . . : A Framework for Analyzing Large-Scale Asset Purchases as a Monetary Policy Tool,” International Journal of Central Banking, vol. 9(1), p. 5-53, January.
Kolasa, M. and G. Wesołowski, (2020), “International spillovers of quantitative easing”, Journal of International Economics, Volume 126.
Johnson, G., S. Kozicki, R. Priftis, L. Suchanek, J. Witmer and J. Yang (2020), “Implementation and Effectiveness of Extended Monetary Policy Tools: Lessons from the Literature”, Bank of Canada Staff Discussion Paper 2020-16.
Ramey, V. A. (2016), ”Macroeconomic shocks and their propagation”, Handbook of macroeconomics 2, 71-162.
Rossi, B. (2020), “Identifying and estimating the effects of unconventional monetary policy: How to do it and what have we learned?”, The Econometrics Journal.
APPENDIX
Figure 1. Peak effects of measures corresponding to one per cent of GDP on output in the euro area, the United States and the United Kingdom depending on where the authors work
Per cent
Note. There are 10 (8) [4] studies where all authors work at a central bank (where some of the authors work at a central bank) [where none of the authors work at a central bank] for the euro area, 6 (8) [5] for the United States and 5 (6) [6] for the United Kingdom (UK). The box marks the first and third quartiles, the unbroken line and the cross inside the box mark the median and average, respectively. The vertical lines (whiskers) going out of the boxes mark the highest and lowest values of the observations not interpreted as outliers. Observations more than one and a half times the quartile distance from the box are regarded as outliers and marked with a dot.
Source: Data from Fabo m.fl. (2020).
Figure 2. Total effects of measures corresponding to one per cent of GDP on inflation in the euro area, the United States and the United Kingdom depending on where the authors work
Percentage points
Note. There are 10 (7) [4] studies where all authors work at a central bank (where some of the authors work at a central bank) [where none of the authors work at a central bank] for the euro area, 5 (8) [5] for the United States and 4 (6) [4] for the United Kingdom (UK). The box marks the first and third quartiles, the unbroken line and the cross inside the box mark the median and average, respectively. The vertical lines (whiskers) going out of the boxes mark the highest and lowest values of the observations not interpreted as outliers. Observations more than one and a half times the quartile distance from the box are regarded as outliers and marked with a dot.
Source: Data from Fabo m.fl. (2020).
Bernanke (2020) argues that the central bank’s asset purchases could contribute to compensating for the effects of the possible lower bound on the policy rate.
A review of the literature can also be found in Borio and Zabai (2016), Bhattarai and Neely (2016) and CGFS (2019). Johnson et al. (2020) focuses on the literature on unconventional monetary policy in small open economies.
Studies are published in scientific journals after a peer-review process, where the publication is read and reviewed by experts on the subject before being accepted for publication. This is a type of quality check to ensure that the published research holds a high standard.
It is also important to know how much the central banks purchase in relation to what is available on the market, but it is difficult to find exact data on this for all countries and all types of asset.
Some studies use GDP, while others use industrial production as proxy for GDP. We do not discuss whether the effects are statistically significant, as this information is missing in several of the studies. Fabo et al. (2020) note that studies of balance sheet policies have on average found greater effects on both output and inflation in relation to the proportion of the authors who were central bank economists. But their results vary depending on the country, see Figure 1 and 2 in Appendix.
Rossi (2020) reports how the effects of changes in the central bank balance sheet are identified in the time series models used in the literature.
See Bhattarai and Neely (2016). In DSGE models, the parameters can either be calibrated to agree with earlier conclusions on how a particular economy functions, or estimated to provide the best fit to the historical development of a number of macroeconomic time series from the economy in question.
The largest effects on output and the smallest effects on inflation can be found in Carlstrom, Fuerst and Paustian (2017). The largest effects on inflation can be found in Gertler and Karadi (2013).
If one excludes extreme values according to the method reported in the note to the figures, Chung et al. (2012), which was published in the Journal of Money, Credit and Banking, is the study that found the largest effect.
See, among others, Bluwstein and Canova (2016), Chen et al. (2017), Alpanda and Kabaca (2020) and Kolasa and Wesolowski (2020).