1. Introduction
Since mid-March, equity indices in the major advanced economies have trended upwards, recovering, at least partially, from the severe drop observed between mid-February and mid-March. However, the degree of recovery has been very heterogeneous. In October, the S&P 500 was above pre-COVID levels, whereas other indices, such the EURO STOXX, were still significantly below their pre-COVID levels (the EURO STOXX was more than 15% down on its February peak).
Some analysts and international organisations, including the IMF1 and the BIS2 , have expressed concerns about the recent recovery in equity prices in a context of still-high uncertainty over the economic recovery. They are suggesting that there is a disconnect between equity markets and the macroeconomic outlook.
In this note we assess the extent to which equity indices are currently overvalued. We focus on two of the major world equity indices: the S&P 500 and the EURO STOXX. The analysis is based on dividend discount models in which equity prices are a function of corporate earnings’ forecasts, the uncertainty surrounding these forecasts and the term structure of interest rates. We show that the horizon over which these forecasts are measured play a key role in the results. In particular, the degree of estimated overvaluation tends to be lower when using measures of earnings based on longer-term horizons. We argue that this is the correct approach since the dividend discount model suggests that the fair value of a stock is the present value of the expected future stream of shareholders’ payouts. Arguably, long-term expectations are a better proxy of this stream than short-term expectations, especially in the context of the COVID-19 crisis where GDP and corporate earnings are expected to post an unprecedented fall in the short term but a significant recovery over longer horizons.
In Section 2, we present the results of the analysis based on equity valuation models that use short-term earnings forecasts. In Section 3, we set out the results using long-term earnings forecasts instead. Finally, Section 4 concludes.
2. Models based on short-term earnings forecasts suggest that equity markets in the US and the euro area are significantly overvalued
To assess potential price misalignments in the stock market we use equity valuation models based on the dividend discount model. In these models, equity prices are expressed as a function of three elements: expected corporate earnings per share (EPS), which proxy expected dividends and other payouts to shareholders; the uncertainty regarding these estimations, which accounts for the equity risk; and the term spread, which summarises the term structure of interest rates.
Following IMF (2019), we first proxy expected earnings forecasts as the weighted average of the analysts’ forecasts of corporate earnings over the next 12 and 18 months from I/B/E/S, while the standard deviation of these forecasts is employed to proxy for the equity risk. Finally, the term spread is calculated as the difference between long-term (10, 20 or 30-year) and short-term (3-month) government bond yields.
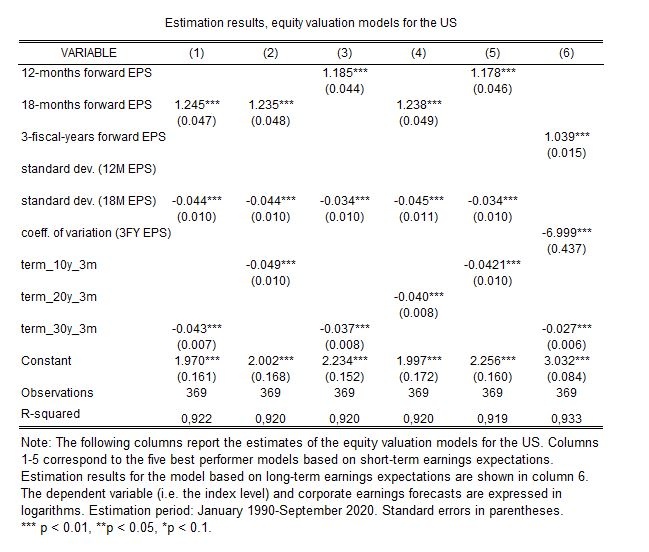
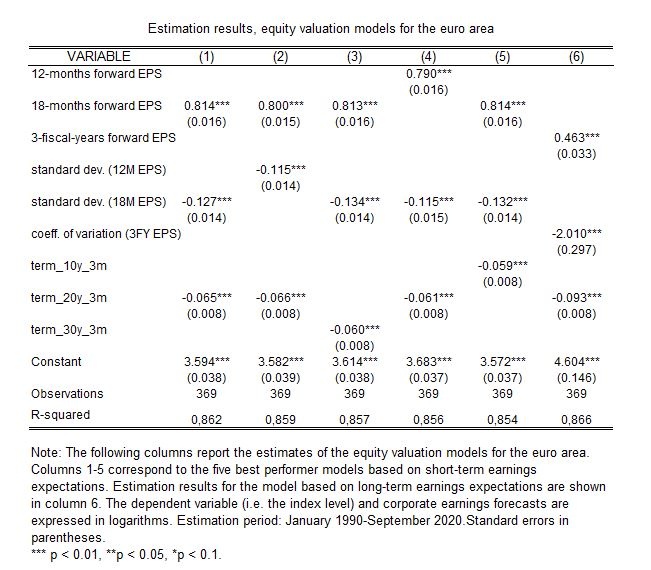
Estimation results for the US (S&P 500) and the euro area (EURO STOXX) are shown in Table 1 (columns 1-5). The estimation sample is from January 1990 until September 20203. We run a total of 12 regressions for each area-specific model, covering all possible linear combinations of the explanatory variables. For brevity, we present the results of the five best performing models in terms of goodness of fit, though all models perform similarly. The average R2 is relatively high for both the US and the euro area (92% and 85%, respectively). Consistent with the economic theory4, we find that an increase in earnings expectations leads to an increase in stock prices, reflecting higher payouts for shareholders. We also find that an increase in the equity risk or the term spread leads to a drop in the stock price index. These results are consistent for all the regressions. For each area, the final model-implied equity valuation is the weighted average of the predicted value of all estimated regressions with weights corresponding to the R2 of the corresponding model.
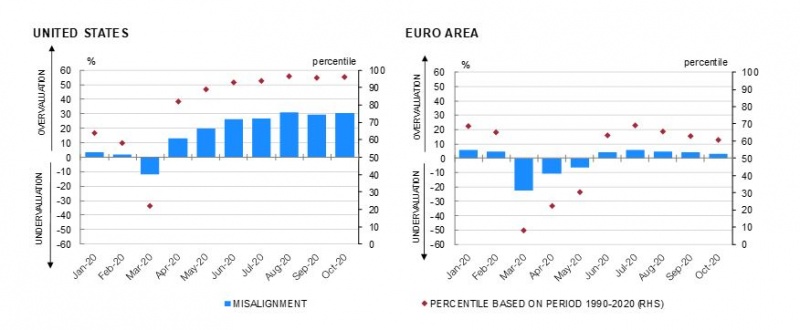
Based on these estimations, equity price misalignments are defined as the difference between the observed value of the index and its predicted value. Figure 1 shows the estimated misalignments during 2020 for both the US and the euro area stock markets.5 These estimated misalignments are in line with those calculated by the IMF in its October 2020 Global Financial Stability Report, which employs a similar approach to estimate mispricing in equity markets. As can be observed, the substantial drop in equity prices between mid-February and mid-March caused by the global spread of COVID-19 gave rise to a reversal in the sign of price misalignments in both the S&P 500 and the EURO STOXX. In March, the former drew very close to its fair value while the latter became undervalued. According to these valuation models, since April, following the equity market recovery, these indices have become highly overvalued, with the S&P 500 reaching in October a level over 40% above its fair value and the EURO STOXX almost 20% overvalued in the same month. These values were close to the maximum historical overvaluation estimates since 1990, standing above the 90th percentile. The reason behind these misalignments would be that the COVID-19 crisis has led to a decrease in corporate earnings expectations and an increase in uncertainty that have not been accompanied by a corresponding equity market correction.
Figure 1. Estimated misalignments. Models based on short-term earnings expectations
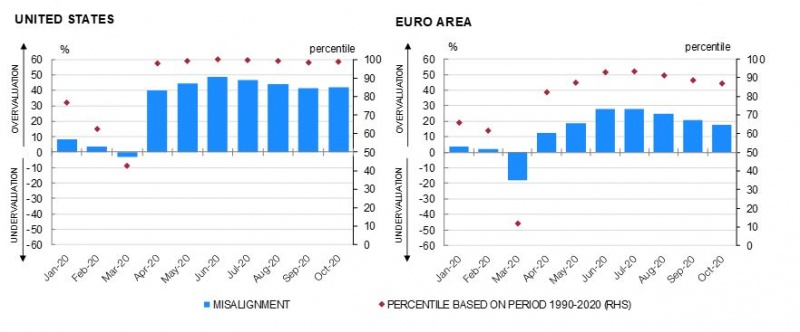
Sources: Thomson Reuters Datastream and authors’ own calculation
3. Instead, models based on long-term earnings forecasts, which are more appropriate in the context of the COVID-19 crisis, suggest a lower degree of overvaluation in the US markets and no signs of overvaluation in the euro area markets
The previous models, based on short-term earnings forecasts, may understate the fair value of the indices in the current context of the COVID-19 crisis, leading to an upward bias in the estimated overvaluation. The reason is that the COVID-19 crisis has caused an unprecedented, but somewhat transitory, contraction in GDP and corporate earnings. Figure 2 compares 12-month- and 18-month-ahead earnings forecasts with 3-fiscal-years-ahead earnings forecasts.6 As can be seen, the drop in the weighted average of expected corporate earnings is more moderate in the long run than in the short-term horizon. The lower panels of Figure 2 show a similar pattern in the case of uncertainty over earnings forecasts, calculated as the coefficient of variation of analysts’ earnings forecasts. In particular, it is found that the uncertainty diminishes when using a long-term measure.
To take these considerations into account, a modified model that includes long-term earnings expectations has been estimated. In addition, the model proxies equity risk using the coefficient of variation of these forecasts instead of the standard deviation, since the latter has a non-desirable upward trend that may also bias recent overvaluation estimations upwards.
Figure 2. Short-term vs long-term earnings expectations
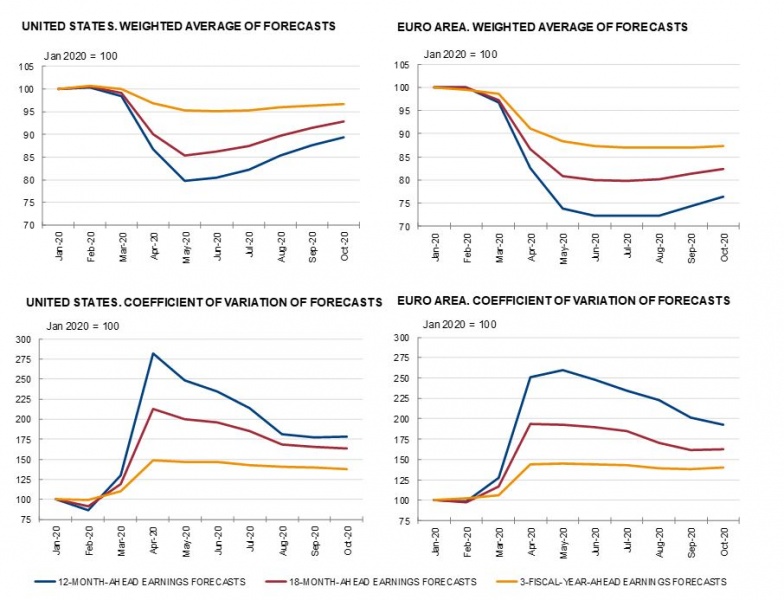
Sources: Thomson Reuters Datastream and authors’ own calculations.
As shown in column 6 of Table 1, the R2 of these modified models are slightly higher than those estimated in Section 2 (93 % for the US model and 87% in the case of the euro area). All coefficients have their sign in line with economic theory and are statistically significant.
Table 1. Estimation results
 |
 |
The estimated misalignments in 2020 for both the US and the euro area stock markets using these modified models are shown in Figure 3. As can be observed, estimated misalignments are now lower than in the previous models, especially for the euro area index. In October, the S&P 500 was around 30% above its fair value while the EURO STOXX was broadly in line with its fundamentals. In terms of the historical distribution of the estimated overvaluation, the S&P 500 was above the 90th percentile, while the EURO STOXX was slightly above the 60th percentile.
Figure 3. Estimated misalignments. Models based on long-term earnings expectations
Sources: Thomson Reuters Datastream and authors’ own calculation
4. Concluding remarks
This note shows that approaches for assessing the potential misalignment of equity prices based on short-term earnings forecasts may yield upward-biased estimates of overvaluation in the context of the COVID-19 crisis. The same applies to traditional metrics based on current earnings, such as the price-to-earnings ratios (PER). Campbell and Shiller (1998) proposed the so-called cyclically adjusted PER to overcome this problem. In particular, instead of using the current level of earnings in the denominator, they proposed using the average of observed earnings over the last 10 years. However, this approach assumes implicitly that the crisis will not have persistent effects on the level of corporate earnings.
We propose instead to use long-term analysts’ earnings forecasts. In particular, we use a dividend discount model similar to that used in IMF (2019), in which the equity prices are a function of corporate earnings’ forecasts, the uncertainty surrounding these forecasts and the term structure of interest rates. In contrast to the model used in IMF (2019), in our model earnings forecasts reflect analysts’ expectations over a longer horizon.
In contrast to alternative approaches based on short-term earnings, our approach suggests that the EURO STOXX is not currently overvalued. The S&P 500 would be overvalued, but to a lesser extent than what these other approaches suggest.
BIS (2020). September 2020 BIS Quarterly Review.
Campbell, J. Y. and R. J. Shiller (1998). Valuation Ratios and the Long-Run Stock Market Outlook. The Journal of Portfolio Management Jan 1998, 24 (2) 11-26.
IMF (2019). October 2019 Global Financial Stability Report.
IMF (2020). October 2020 Global Financial Stability Report.
IMF (2020).
BIS (2020).
See e.g., Campbell and Shiller (1988).
The IMF methodology can be found in the following annex: https://www.imf.org/~/media/Files/Publications/GFSR/2019/October/English/onlineannex11.ashx