Disclaimer1
During the crisis, mobility indicators were a good guide to GDP and retail sales, and power demand for industrial production. These relations may guide the impact of a second wave – but we are sceptical that they hold more broadly.
New measures of a new crisis: The fast-moving Covid-19 crisis has increased demand for indicators that track economic activity in close to real-time, leading traditional hard and survey data by several weeks. Most of these high-frequency indicators (HFIs) are untested and come without much history. Through the crisis, we found that mobility data have been good predictors of GDP and retail sales, and power demand a reasonable predictor of industrial production. The Oxford Stringency Index also performed well in tracking the original contraction, though we don’t expect this performance to continue. Other indicators, such as congestion and pollution proved less reliable. We would expect these relationships to hold in a second lockdown, but not in general.
A rising tide lifts all boats: We have seen a strong rebound in hard data in recent months, with retail sales bottoming out in April before surging to pre-crisis levels in June and manufacturing production experiencing a robust, but more gradual rebound, remaining ~8% below pre-crisis levels in July. This was broadly mirrored in the movement of HFIs, which also continued improving into 3Q. Given that these indicators are driven by the same underlying factors – Covid and lockdowns – they are highly correlated over time. In our analysis we look for robust relationships across months, as well as across countries within months.
Mobility outperforms: We compare the Oxford Stringency Index and mobility data from Google and Apple to GDP, and find that the former is a reasonable predictor of 1H20 aggregate contractions, while the latter two also explain the cross country variation of quarterly data. Retail sales are highly correlated with mobility, while lockdown strength is found to be less robust. Industrial production has meanwhile moved together with power demand throughout the crisis, and we find some evidence for a more general relationship in Germany.
Good in this crisis, but not yet proven: With most HFIs back at pre-crisis levels, we are sceptical that the relationships identified over the crisis will continue to hold. Observing HFIs plummeting together once, during a record contraction, before recovering again provides only limited support for assuming a relationship outside of crisis times, when expected changes are also much smaller. Instead, we expect conventional indicators such as PMIs – which were a poor guide during the crisis, holding below 50 in May and June even as the economy rebounded strongly – to move back into focus. Still, we will continue to track HFIs for early signs that restrictions imposed in response to the ongoing second wave of Covid are starting to impact economic activity again.
Exhibit 1 – HFIs have rebounded strongly
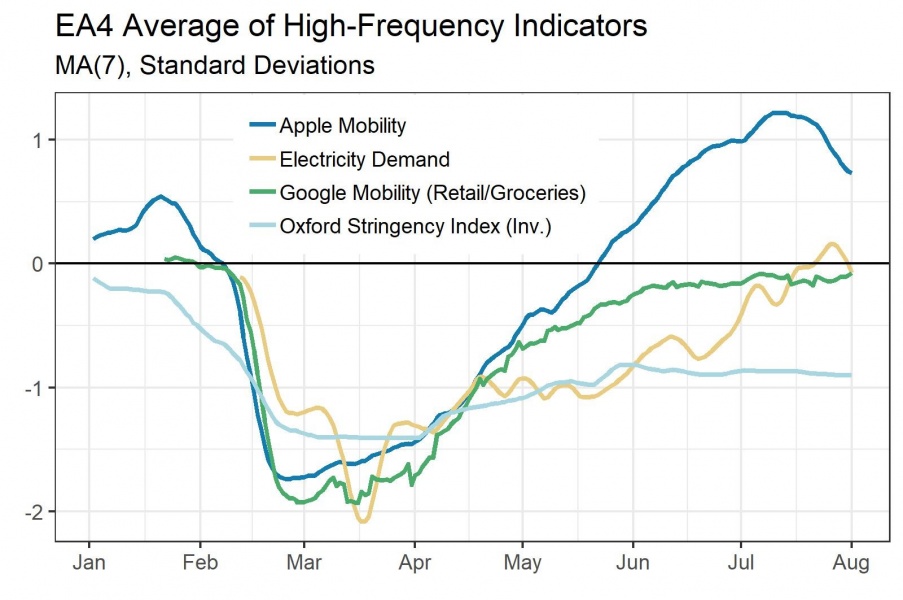
Source: Apple, Google, Oxford University, ENTSO-E, TomTom, Morgan Stanley
Exhibit 2 – … mirrored by hard and survey data
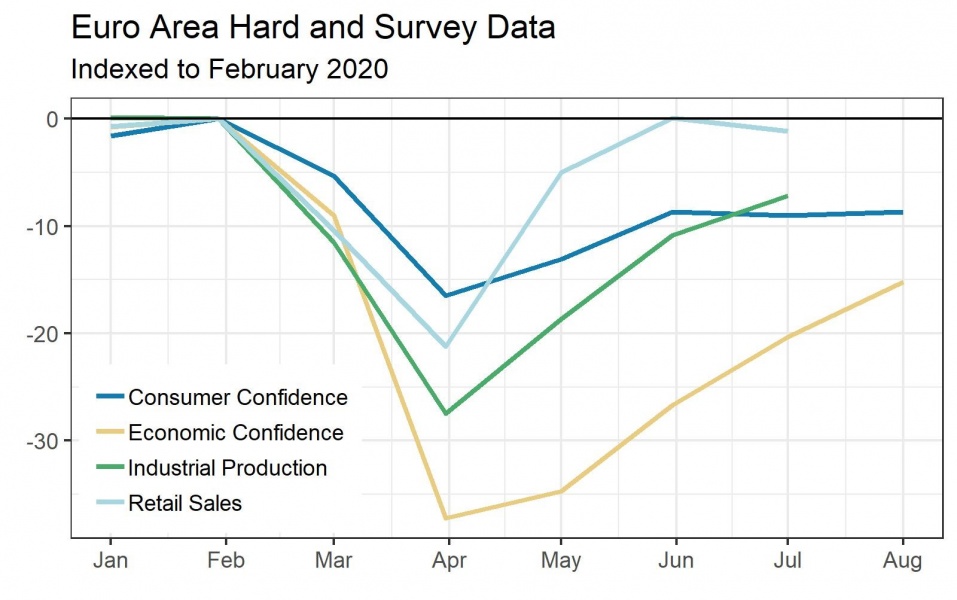
Source: Eurostat, Morgan Stanley Research
Exhibit 3 – Unreliable PMIs: Sub 50, even as May-June hard data rebounded strongly
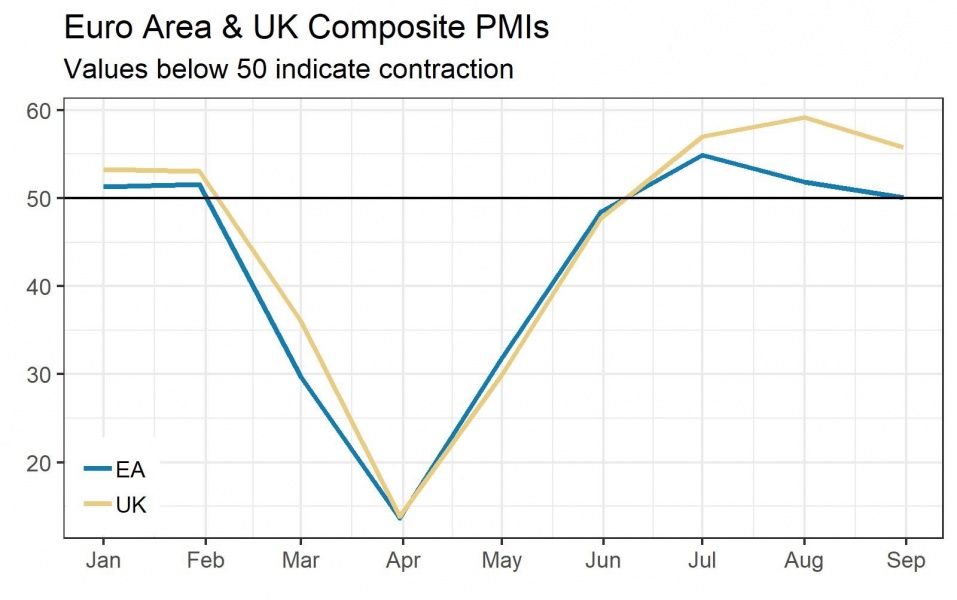
Source: IHS Markit, Morgan Stanley Research
A new guide to growth? We compared different mobility indices and the Oxford Stringency Index, a composite measure of lockdown strength, to the magnitude of contractions in 1H, in order to assess if those countries that saw greater falls in mobility or introduced stricter lockdown measures have seen larger falls in GDP.
Tracking GDP with mobility indices: We compared national 1H20 contractions with the Google Mobility Index, which tracks visits to various types of locations. Specifically, we have looked at the average of the retail and recreational, and the groceries and pharmacies sub-indices. The rational is that fewer visits should be indicative of a lower private consumption component of GDP.
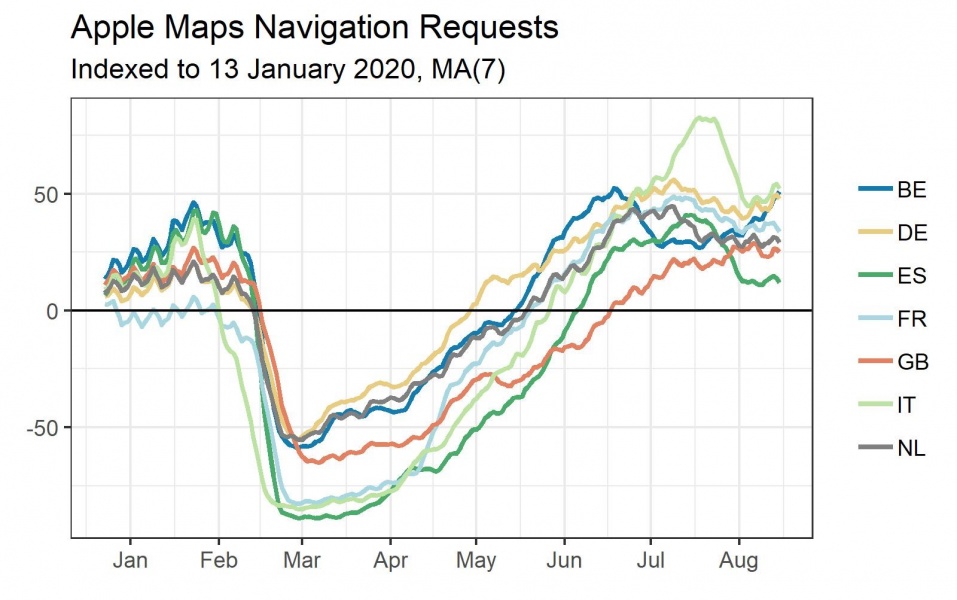
Strong relationship in 1H… We find a strong relationship between the index level and cumulative GDP growth in the first half of the year: contractions were larger where mobility was lower. This result also holds when considering navigation requests to Apple Maps instead of the Google index, and just household consumption instead of overall GDP. Austria, which locked down early and efficiently, performs better than our model would suggest, while the UK shows up as a negative outlier.
… as well as between quarters: Mobility also explains %Q GDP variation between countries in the same quarter rather well. We compare the change in average mobility between quarters to %Q GDP growth and find those countries that experienced larger drops in mobility consequently saw bigger contractions. The fact that mobility indices are direct measurements of activity likely explains some of the superior performance compared to more subjective measures.
3Q and beyond: While we find evidence to suggest that Google Mobility was a timely predictor of GDP across the crisis quarters of the first half of the year, we are more sceptical about its use as a gauge for the rebound in 3Q and beyond, especially as mobility indices are already back around pre-crisis levels in most countries. Given the instantaneous relationship we have identified, we nonetheless keep a close eye on this indicator for signs of any impact from the re-introduction of distancing measures in response to a second wave of Covid. While those might be more targeted and regional in nature, mobility indicators should still be helpful in assessing the relative impact across countries.
Exhibit 4 – Most Google mobility indices have already recovered to pre-crisis levels, with the UK as the laggard
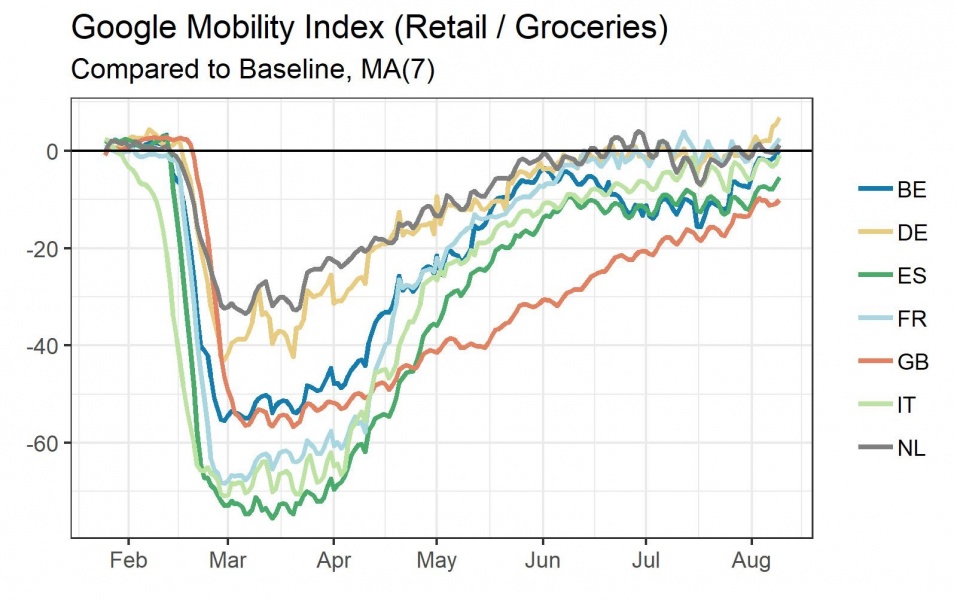
Source: Google, Morgan Stanley Research
Exhibit 5 – We find a strong relationship when considering 1H20 in aggregate
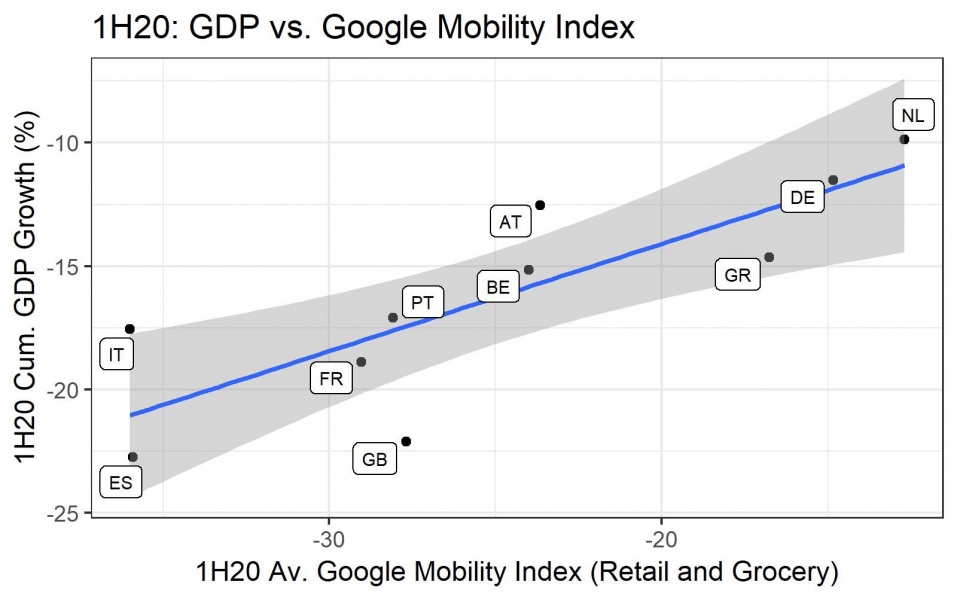
Source: Google, Morgan Stanley Research; Note: 95% confidence interval in grey
Exhibit 6 – … as well as when considering quarters individually
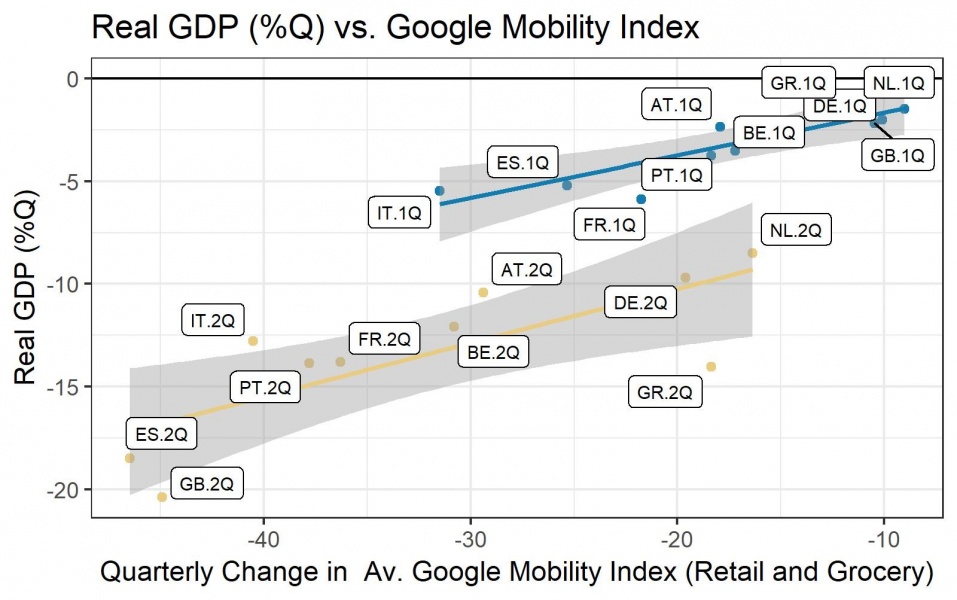
Source: Google, Morgan Stanley Research; Note: 95% confidence interval in grey
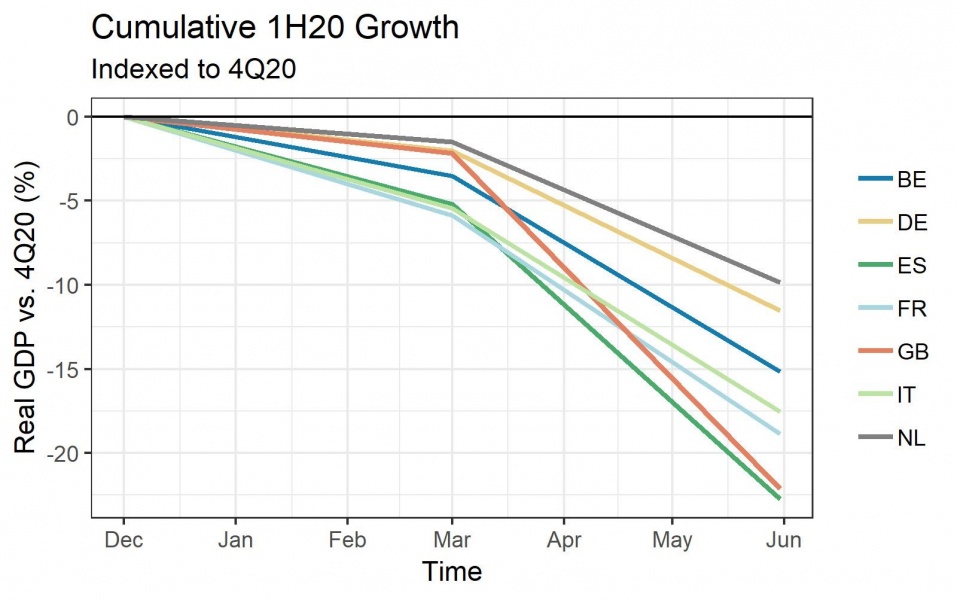
Stringency predicts 1H GDP… Comparing the average lockdown strength across 1Q and 2Q to the cumulative contraction over this period, we find a strong (if perhaps obvious) relationship: deeper, longer lockdowns have resulted in larger contractions. There are several outliers, likely due to different fiscal responses, the types of lockdown, and the medical impact. Germany and the Netherlands have outperformed our estimates, as they were less impacted by the virus and the structures of their economies make them somewhat less susceptible to social distancing, while the UK and Spain have done slightly worse.
… but not on a quarterly basis: We find a less strong relationship between %Q GDP and the quarter-on-quarter change in the index however – especially in 2Q, as diverging national policy responses gained in importance. We conclude that the relationship is unlikely to hold as GDP rebounds in Q3, as the index remains elevated, or more generally outside the specific circumstances of another lockdown.
Subjective drawbacks: We furthermore note that significant judgement is involved in choices about both the methodology and how to score particular policy measures, which raises some questions about the index as a leading indicator. That said, we would expect this indicator to once again become a useful growth indicator to watch, if countries were to re-impose more restrictions to slow the second wave of Covid.
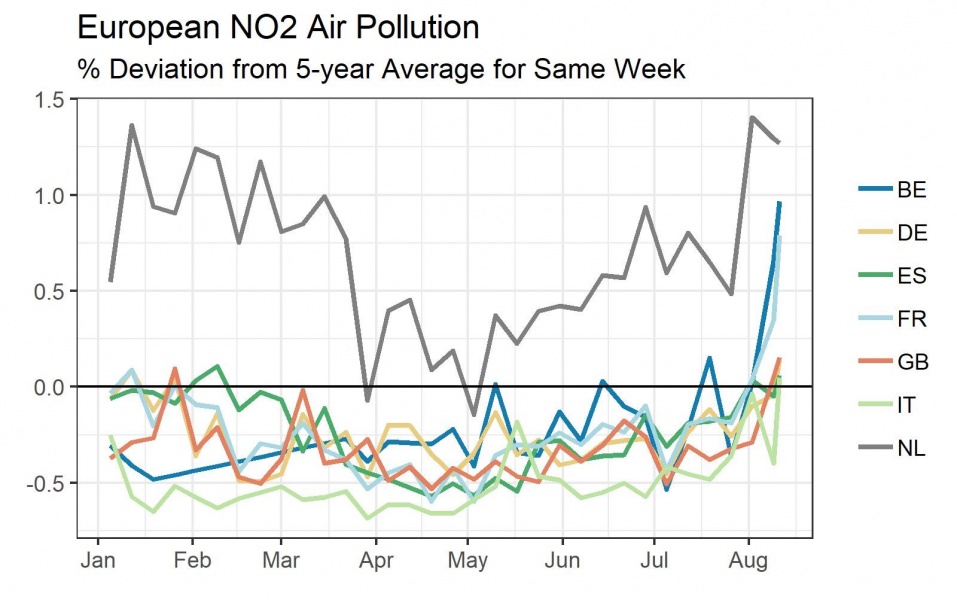
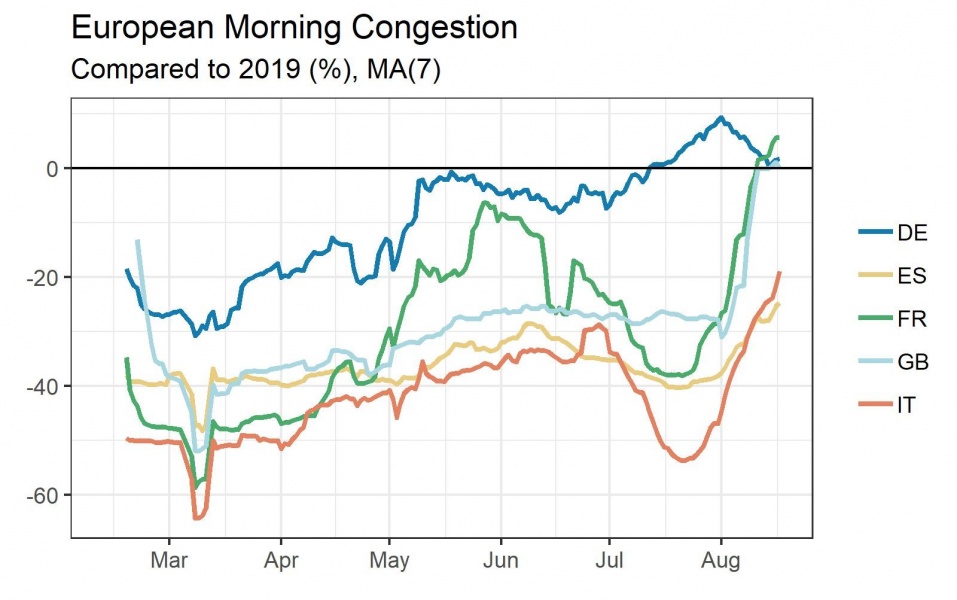
What didn’t work: We note that indicators such as morning congestion in the largest European cities and NO2 air pollution – often associated with industry and car traffic – proved to be very volatile and did not show consistent relationships with overall GDP growth.
Exhibit 7 – The Covid crisis affected countries to different degrees, with southern Europe generally more impacted than the north
Source: Eurostat, Morgan Stanley Research
Exhibit 8 – With infections rising again, the lifting of restrictions has been put on hold
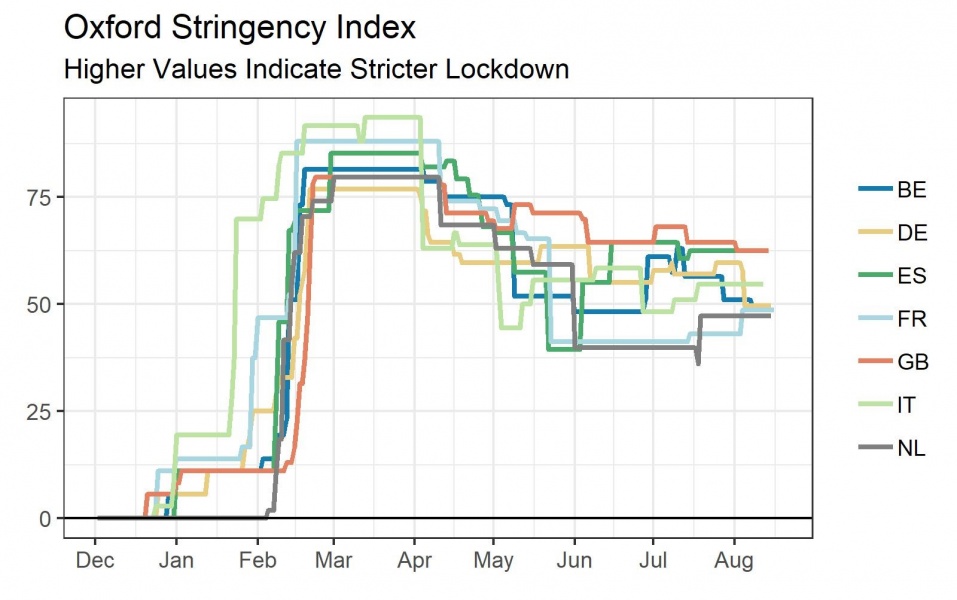
Source: Oxford University, Morgan Stanley Research
Exhibit 9 – Stricter lockdowns resulted in bigger drawdowns in the first half of the year…
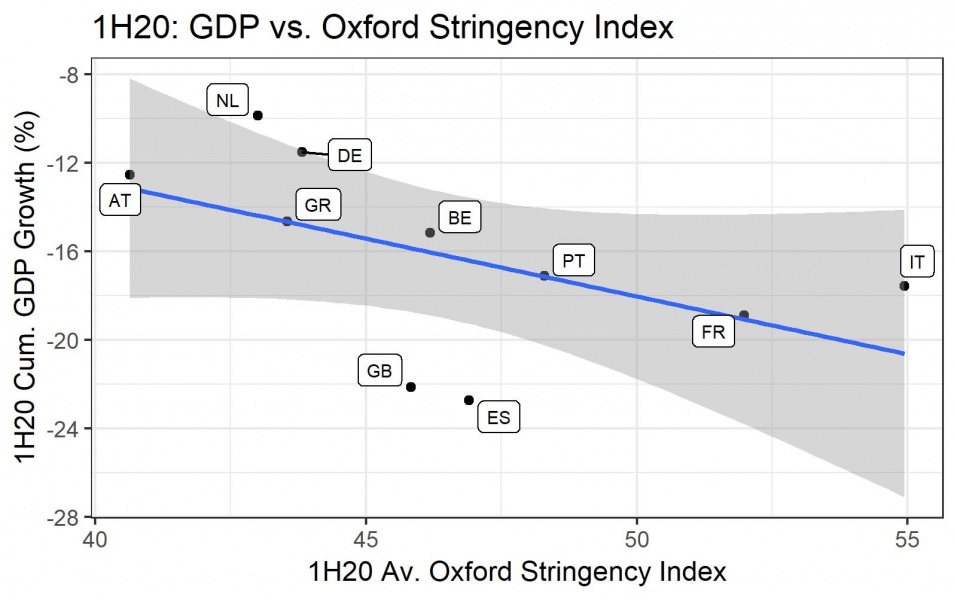
Source: Eurostat, Oxford University, Morgan Stanley Research; Note: 95% confidence interval in grey
Exhibit 10 – … but the relationship is less clear on a quarterly basis, especially in 2Q
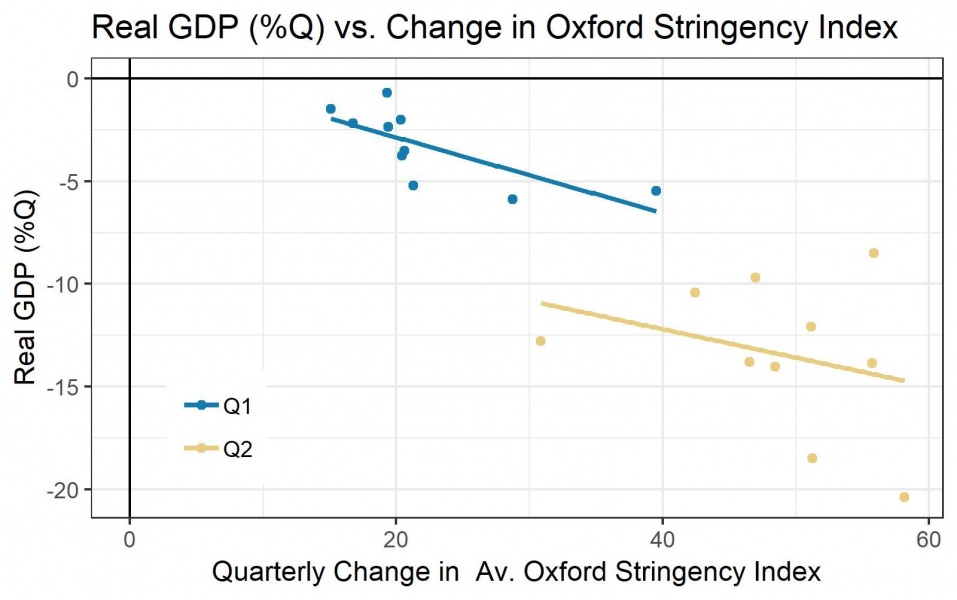
Source: Eurostat, Oxford University, Morgan Stanley Research
Strong rebound, some giveback: The consumer sector bounced back strong in May and June following April’s record lows, supported by pent-up demand during lockdowns and labour market support via furlough schemes. This was followed by weakening July prints however. We now look at the explanatory power of mobility and lockdown strength for retail prints throughout the crisis.
Mixed results for lockdown strength: Comparing %M retail sales (ex. autos) with the change in the lockdown strength, we find that months in which restrictions tightened have indeed seen lower retail sales on average (and vice versa). But we only find limited evidence to suggest that the index explains the variation between countries within months, which raises doubts about the robustness of this relationship.
Mobility scores again: Both our mobility indices from Google and Apple meanwhile perform relatively well, showing strong and (fairly) consistent relationships across time and between countries within each month. The findings suggest that stronger mobility coincided with better retail performance, which makes intuitive sense as retail is still predominately a physical experience, despite the rise of online retail.
Cautiously optimistic going forward: We note that the relationship started breaking down in July however, when retail sales returned to more normal levels and the index had mostly recovered. The strength of the identified relationship nonetheless makes us confident that mobility indicators would be useful as a first warning sign of repeated retail weakness, e.g. if more restrictions were to be re-imposed.
Exhibit 11 – Retail sales have seen a sharp snap-back, driven by pent-up demand
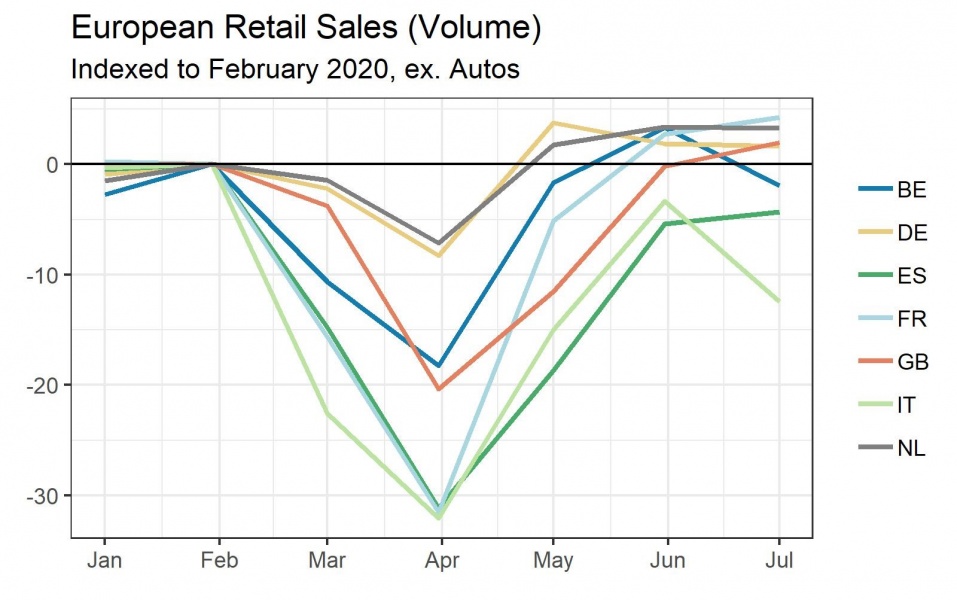
Source: Eurostat, Morgan Stanley Research
Exhibit 12 – Lockdown strength is only a mediocre predictor for retail sales, when controlling for months
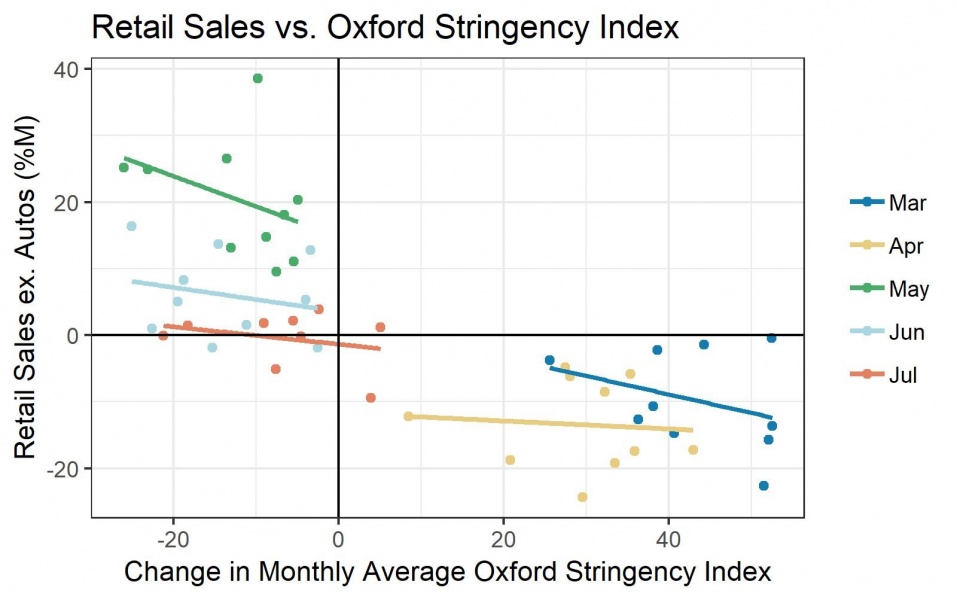
Source: Eurostat, Morgan Stanley Research
Exhibit 13 – Google mobility was a strong predictor of retail sales…
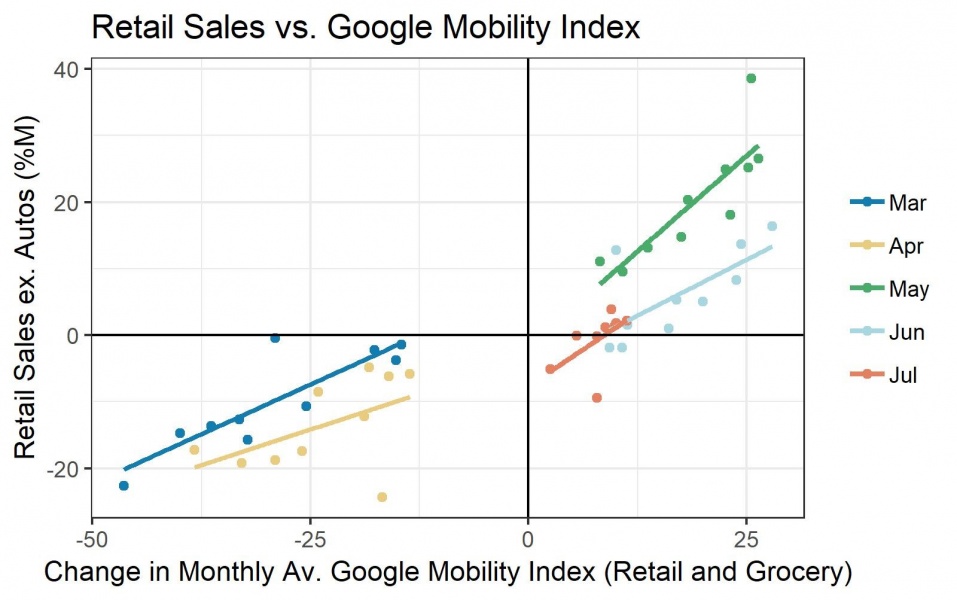
Source: Google, Morgan Stanley Research
Exhibit 14 – … with Apple Maps navigation requests close behind
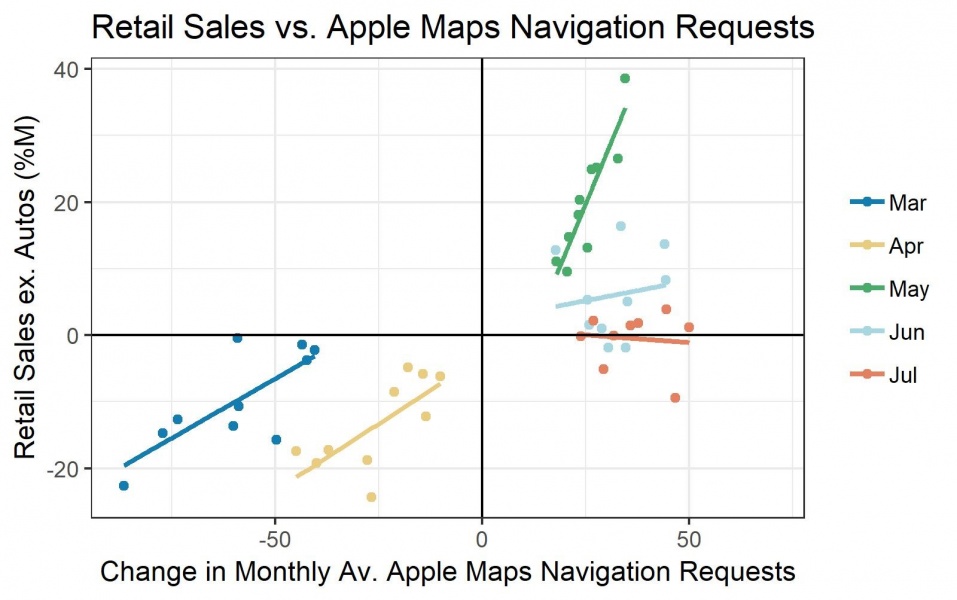
Source: Apple, Morgan Stanley Research; Note: Due to data availability we only consider Apple Maps navigation requests for driving and walking (and exclude public transport)
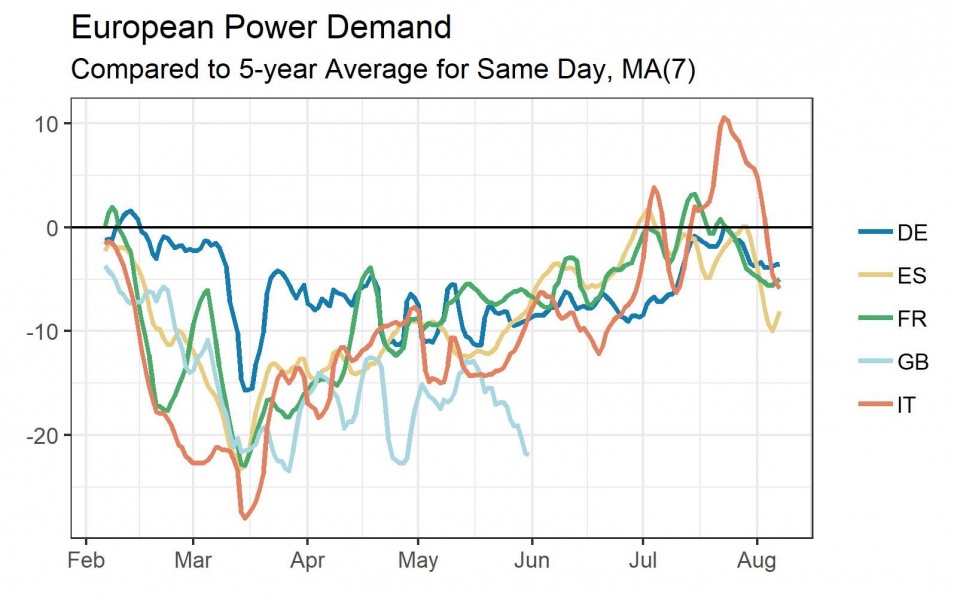
Industry slower to recover: The European manufacturing sector experienced a deep slump during the Covid lockdown, and has seen a rather robust bounce-back since. But with production still around 8% below pre-crisis levels, it has so far lagged the recovery in the consumer sector. We are particularly interested in manufacturing production, which we compared to electricity demand and NO2 air pollution. According to our working hypothesis, higher levels of industrial activity should coincide with increases in both.
Reasonable relationship with power demand: We compare %M changes in manufacturing production with changes in the average monthly power demand compared to the long-time average for the same day, and find a reasonably strong connection for most crisis months. April – the trough of the crisis – is the exception, where differences in power demand are not matched by variation in production.
Long-term connection: Using electricity data since 2015, we furthermore assess the long-term relationship, comparing %M production with unadjusted monthly changes in power demand. We find a significant result in most countries except France, with strong co-movement during the crisis. Excluding recent months, the results become less reliable, but we still find a meaningful relationship in Germany, which is characterised by a power-hungry industrial sector.
Pollution too volatile: We also compared production to air pollution, but did not find meaningful results. This is likely due to the fact that NO2 is more closely associated with traffic, instead of industrial processes, and driven by other factors such as weather.
Exhibit 15 – Manufacturing production remains ~8% below pre-crisis levels in July
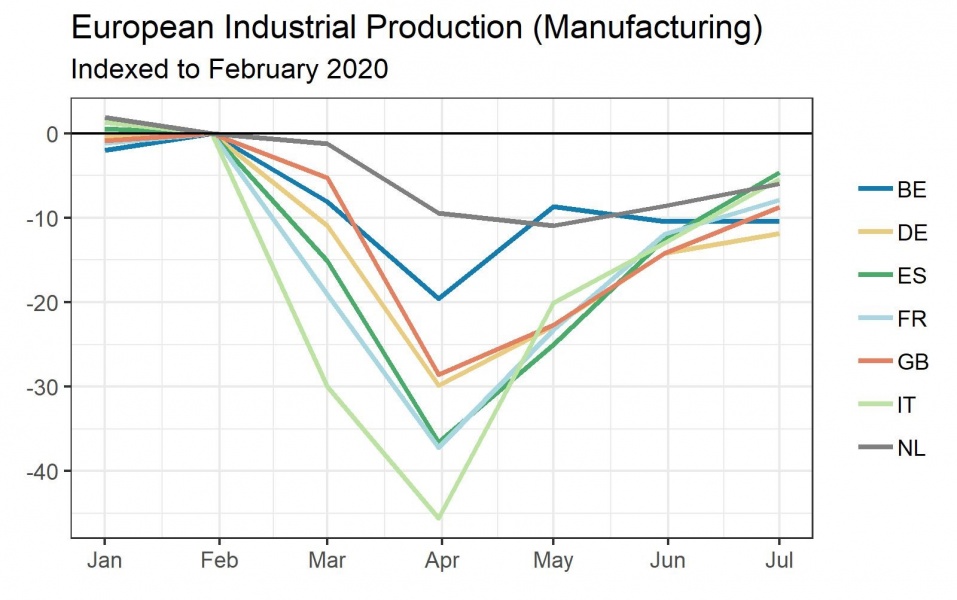
Source: Eurostat, Morgan Stanley Research
Exhibit 16 – Power demand had recovered, but is now around 5% below normal

Source: ENTSO-E, Morgan Stanley Research; Note: UK data available until end 2Q20
Exhibit 17 – Power demand seems to have some explanatory power…
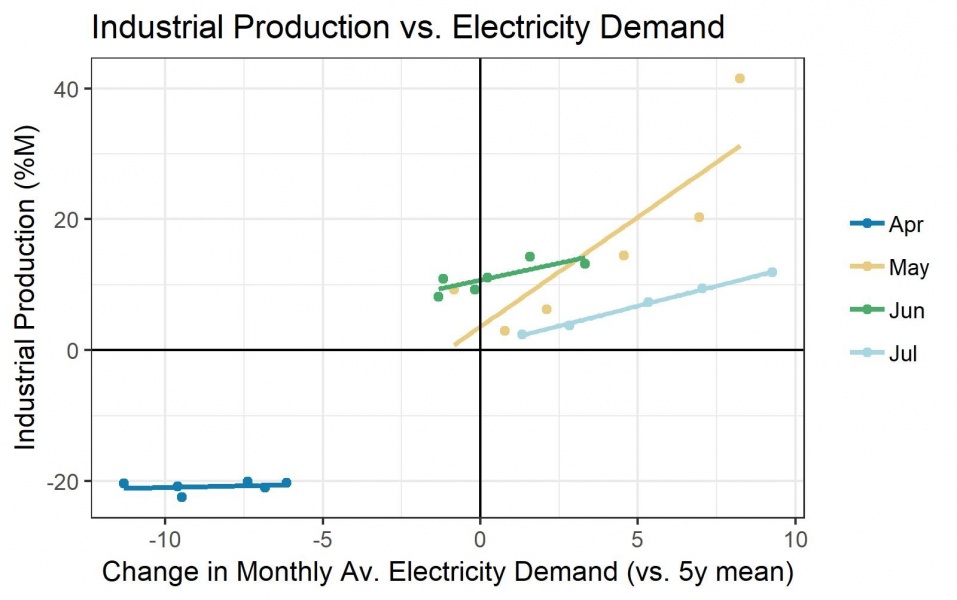
Source: ENTSO-E, Morgan Stanley Research
Exhibit 18 – … which cannot be said for NO2 air pollution
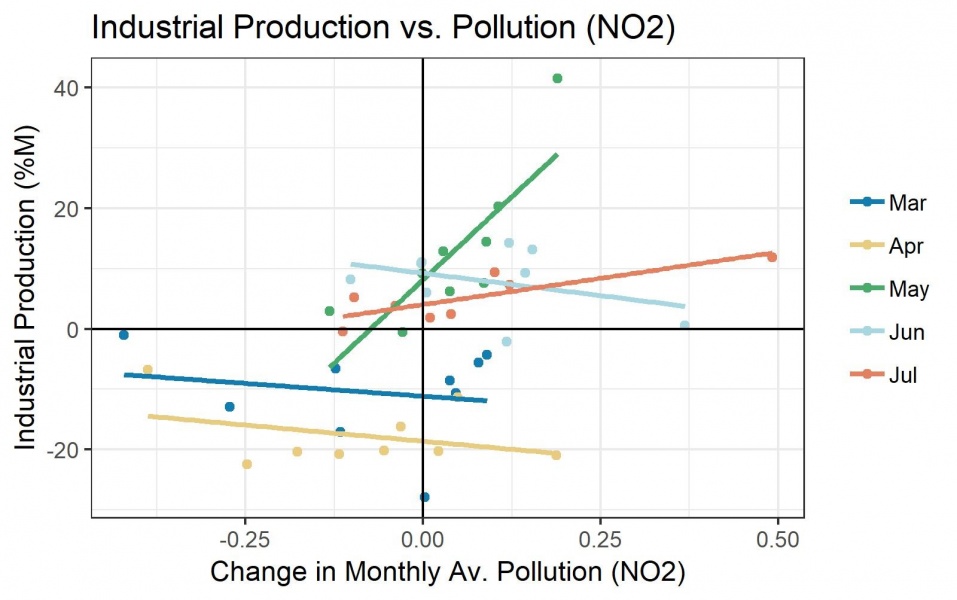
Source: Aqicn, Morgan Stanley Research
| Exhibit 19 – Compared to GDP and retail sales | Exhibit 20 – Compared to industrial production |
 |
 |
| Source: Oxford University, Morgan Stanley Research | Source: ENTSO-E, Morgan Stanley Research |
| Exhibit 21 – Compared to GDP and retail sales | Exhibit 22 – Compared to GDP and retail sales |
 |
 |
| Source: Apple, Morgan Stanley Research | Source: Google, Morgan Stanley Research |
| Exhibit 23 – Compared to industrial production | Exhibit 24 – Compared to GDP and retail sales |
 |
 |
| Source: AQICN, Morgan Stanley Research | Source: TomTom, Morgan Stanley Research; Note: Based on the largest two cities in each country (London for the UK) |
This article is based on research published for Morgan Stanley Research on September 29, 2020. It is not an offer to buy or sell any security/instruments or to participate in a trading strategy. For important current disclosures that pertain to Morgan Stanley, please refer to Morgan Stanley’s disclosure website: https://www.morganstanley.com/eqr/disclosures/webapp/generalresearch.
Copyright 2020 Morgan Stanley.