When a new investment vehicle challenges and surpasses the asset base of long-established rivals, it’s worth inquiring into the causes that contributed to this achievement. The shift of assets from active to passive management, as illustrated in Exhibit 1, surely must count as one of the most important developments in modern financial history. Our intent in this policy note is to suggest why this transformation came about; the answer, in our view, lies both in a set of observations and in the subsequent explanation of those observations. Because these explanations are robust and universal, the shift of assets from active to index management is likely to persist.
Exhibit 1. Approximately USD 4.6 Trillion Tracks the S&P 500®
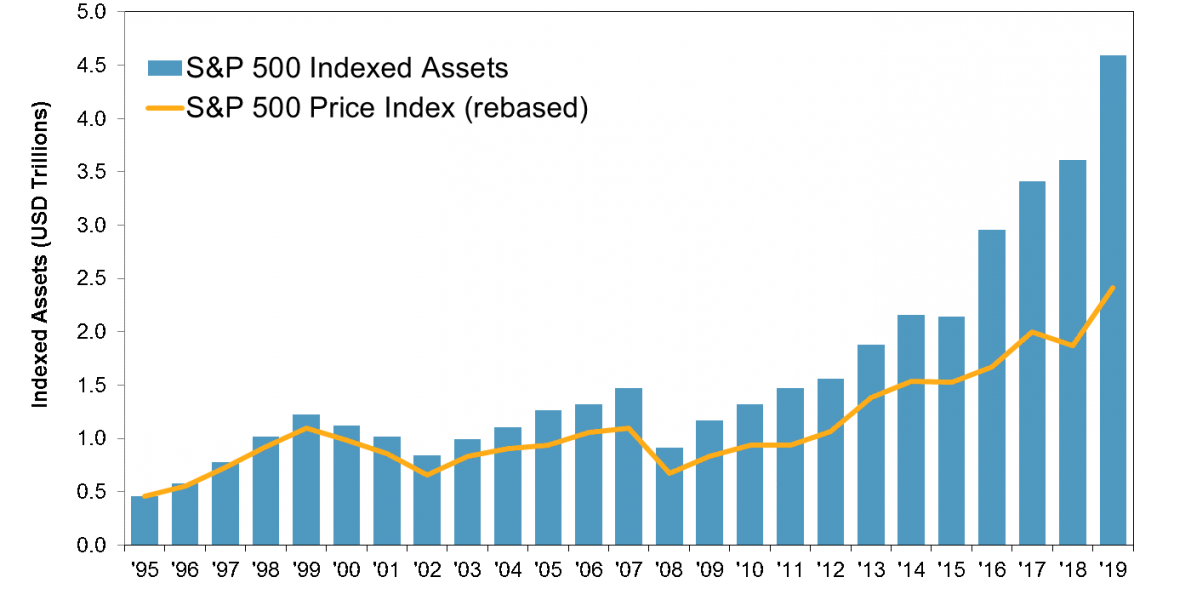
Source: S&P Dow Jones Indices. Data as of Dec. 31, 2019. Charts are provided for illustrative purposes. Past performance is no guarantee of future results.
Fifty years ago, there were no index funds; all assets were managed actively. The shift from active to passive began as the academic community called attention to the failure of the average active manager to outperform passive benchmarks.
The most influential voice may have been that of Nobel laureate Paul Samuelson, who suggested in 1974 that “some large foundation should set up an in-house portfolio that tracks the S&P 500 Index—if only for the purpose of setting up a naïve model against which their in-house gunslingers can measure their prowess.”1 Samuelson’s evaluation of active portfolio managers was biting: “a respect for evidence compels me to incline toward the hypothesis that most portfolio decision makers should go out of business—take up plumbing, teach Greek, or help produce the annual GNP by serving as corporate executives.” Samuelson’s wish for an S&P 500 index fund was granted, perhaps more rapidly than he expected,2 as index funds became available, even to retail investors, in the 1970s.3
Although many things have changed in the intervening five decades, the performance data that animated Samuelson and his contemporaries have been remarkably robust. Our firm’s SPIVA® reports have documented the performance of U.S. managers since 2001 (with shorter histories for other markets), and the results have been almost uniformly discouraging for the advocates of active management. Exhibit 2 illustrates the most recent update for U.S. managers.4
Exhibit 2. Most U.S. Active Managers Underperform Their Benchmarks
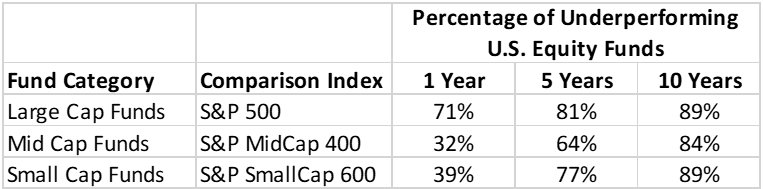
Source: S&P Dow Jones Indices LLC, CRSP. Data as of Dec. 31, 2019. Past performance is no guarantee of future results. Table is provided for illustrative purposes.
We observe that most active funds underperformed benchmarks appropriate to their investment style. This is not unusual—in fact, over the history of the SPIVA database, underperformance is far more common than not. Moreover, extending the time horizon makes active management look worse, not better. This is consistent with the view that the true odds of outperformance are less than even. If the true likelihood of outperformance were greater than 50%, we would expect to see fluctuations above and below 50% over short intervals (such as one year), but over time we would expect to see more outperformers than underperformers. In fact, we observe the opposite.
Moreover, it’s notable that active managers of mid- and small-cap portfolios seem to have just as much difficulty as their large-cap peers. This is not an intuitive conclusion; in fact it’s sometimes argued that investors should index large-cap, well-researched, relatively “efficient” stocks and use active managers in the less well-covered mid- and small-cap arenas. At first blush, this is plausible, and it’s certainly true that research coverage is tilted toward larger companies. However, the scarcity of research coverage only implies that the likelihood of misvaluation is higher among smaller companies. There’s no reason to assume that the likelihood of undervaluation is higher, and it’s the assumption of undervaluation that’s critical to the argument for active management of smaller stocks.
We would argue, in fact, that overvaluation is at least as likely as undervaluation among smaller names. A manager who thinks he sees undervaluation can take advantage of it by buying the undervalued stock. A manager who thinks he sees overvaluation can sell his position down to zero. After that, he’s helpless—unless he wants to borrow stock in order to short it, and smaller names can often be quite difficult (or expensive) to borrow. This implies that overvaluation is likely to be more persistent than undervaluation; it’s simply harder to get rid of it.
European managers are similarly challenged, as illustrated by Exhibit 3.5
Exhibit 3. Most European Active Managers Underperform Their Benchmarks
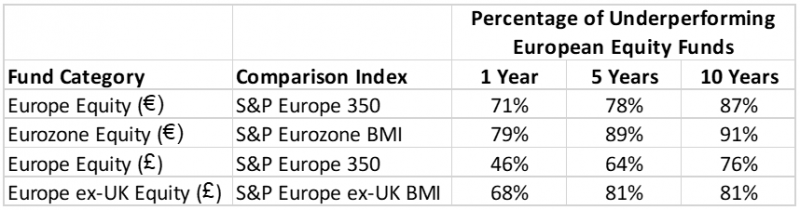
Source: S&P Dow Jones Indices LLC, Morningstar. Data as of Dec. 31, 2019. Past performance is no guarantee of future results. Table is provided for illustrative purposes.
If a majority of active managers underperform, it’s nonetheless theoretically possible that some managers are consistently above average. Samuelson was explicit on this point: “It is not ordained in heaven…that a small group of intelligent and informed investors cannot systematically achieve higher mean portfolio gains with lower average variabilities. People differ in their heights, pulchritude, and acidity. Why not in their P.Q. or performance quotient?”6 When an active manager beats a benchmark, how can we judge whether this result is a product of genuine skill or merely of good luck? Genuine skill is likely to persist, while luck is random and soon dissipates. Therefore one key measure of active management skill is the consistency of a fund’s outperformance.
We can test for this consistency in a number of ways, one of which is shown in Exhibit 4. In this exhibit we use 10 years of history from the U.S. SPIVA database. We ask, for managers in the upper half of the performance distribution in the first five years, how many were also in the upper half in the second five years?7
Exhibit 4. Past Success Does Not Predict Future Success
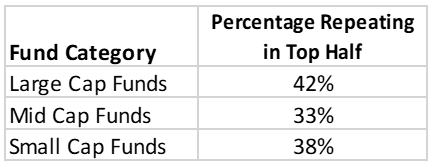
Source: S&P Dow Jones Indices LLC, CRSP. Data for 10 years ending Dec. 31, 2019.
Past performance is no guarantee of future results. Table is provided for illustrative purposes.
If there were no relationship between past and future performance – in other words, if performance were completely random – we’d expect that 50% of the managers in the upper half of the distribution in the first five years would also be in the upper half for the second five years. The actual results are even worse than random chance would suggest.8
The evidence, over many years, is clear:
These facts call out for an explanation! Active managers are smart people; they’re well educated, they work hard, and they’re motivated (financially and otherwise) to a fault. Despite all that, why do they fail more often than they succeed?
Professionalization
Investment management is a zero-sum game. There is no natural source of outperformance, or “alpha;” the outperformance of above-average investors is offset by the underperformance of below-average investors. “Investors” in this sense encompasses not just professional money managers, but any owner of securities. These owners may well be undiversified owners of concentrated positions who are not aware that they’re in a zero-sum game. Indeed, they may not be aware that there’s a game at all.
Imagine, for example, a conservative retail investor who owns several high-quality, dividend-paying utility companies because she values their relatively secure income stream. Such an investor is a potential source of alpha for every professional manager who is underweight utilities. Similarly, every corporate executive who owns a concentrated position in his own company’s stock is a potential source of alpha for every professional manager who is underweight that industry or company. If professional investors represent a relatively small fraction of a market’s assets, such undiversified amateurs can be an important source of the professionals’ outperformance. The outperformance garnered by professionals, in other words, could be provided by the underperformance of amateurs.9
However, if professionals become the dominant force in a market and amateur investors are relatively unimportant, the game changes—the professionals are now competing against each other. In the U.S., professionals had come to dominate by the mid-1970s, as Ellis’ 1975 assessment makes clear: “Gifted, determined, ambitious professionals have come into investment management in such large numbers during the past 30 years that it may no longer be feasible for any of them to profit from the errors of all the others sufficiently often and by sufficient magnitude to beat the market averages.”10 This is why indexing began in the 1970s – not 20 years sooner or 20 years later.
It’s important here to distinguish between absolute and relative skill. Absolute skill in active investing requires managers to access information and to form, based on some combination of fundamental, technical, and quantitative metrics, an assessment of the difference between a stock’s current price and its ultimate value. To criticize active managers’ performance is by no means to impugn their absolute level of skill.11 But managers don’t operate in a vacuum. Absolute skill may be necessary for success as an active manager, but it is not sufficient. It’s relative skill that determines outperformance and underperformance. It’s not enough to be good at valuing companies; a successful active manager has to be better than his competitors.
If investment management is not unique in this respect, it at least is highly unusual. An average physician may be able to cure most illnesses, and an average lawyer may be a perfectly adequate source of legal representation for most needs. Indeed, below-average physicians and lawyers may still be of considerable value to their clients. Investment management is different: an average investment manager is of no value at all. “Investing is unusual, in that the collective judgement of all the participants (weighted by the amount of money they control) is…available for free….If a professional investor is to earn excess returns for his client, being good is insufficient – he must be exceptional.”12
Consider what happens when assets move from active managers to index funds. Presumably the least capable active managers lose the most assets. This means that the quality of the surviving active managers rises as assets move to their passive counterparts. Active managers will find it harder to stay above average as index funds cull the weakest competitors.13
Cost
Lower cost is the simplest explanation for the success of passive management. Imagine a market in which all assets are actively managed, and into which a passive alternative is, deus ex machina, inserted. This passive alternative buys a pro-rata slice of every company in the market. Since the passive managers buy a pro-rata share of every stock’s capitalization, their portfolio, in aggregate, will be identical to the aggregate portfolio of the active managers. Before costs, therefore, the passive and active portfolios will have the same return.
However, active managers’ costs—for research, trading, management fees, etc.—are inherently higher than those of passive managers. Thus, “properly measured, the average actively managed dollar must underperform the average passively managed dollar, net of costs.”14
To illustrate the importance of costs, consider that the average expense ratio for active U.S. equity mutual fund managers in 2019 was 0.74%, compared to only 0.07% for their passive competitors.15 This difference of approximately 65 bps offers investors an automatic advantage for choosing a passive manager versus an active one. The growing popularity of index funds, along with industry consolidation and economies of scale, has the potential to lower the costs of passive vehicles further.
Skewness
In a normal distribution, observations array symmetrically around their average value. The cross-sectional distribution of stock returns is not normal, but rather is positively skewed – i.e., the average value is greater than the median. This isn’t surprising – after all, a stock can only go down by 100%, while it can appreciate by much more than that. Large positive values pull the average level of the distribution above the midpoint.
We can observe this in Exhibit 5, which plots the distribution of cumulative returns for the constituent stocks of the S&P 500 for the last 20 years. The median return was 52%, far less than the average of 239%. Exhibit 6 shows similar results for the S&P Europe 350, where the 36% median lagged the 136% average. Notably, the positive skew in equity returns demonstrated by Exhibits 5 and 6 is not simply an artifact of a small number of highly-skewed years: in the 29 years between 1991 and 2019, e.g., the average S&P 500 stock outperformed the median 25 times.16
If stock returns were normally distributed, stock selection would be no harder than a coin flip; a randomly-chosen stock would have an even chance of delivering above-average performance. When the distribution is skewed, selection becomes much harder. Of the 1010 stocks that were part of the S&P 500 between 2000 and 2019, only 267 were above average. The probability that a randomly-chosen stock would deliver above-average performance, in other words, was 26%, not 50%. When fewer stocks outperform, active management is harder.
Exhibit 5. Constituent Returns for S&P 500 Members Are Highly Skewed
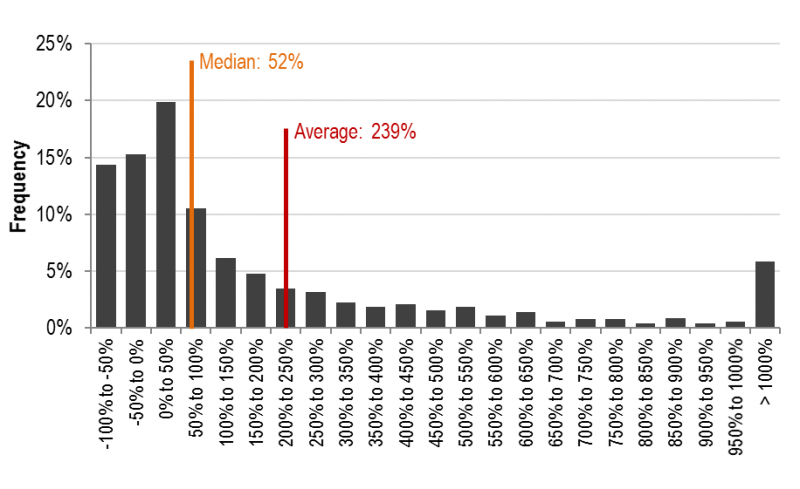
Source: S&P Dow Jones Indices LLC, Factset. Data from Dec. 31, 1999 to Dec. 31, 2019. Past performance is no guarantee of future results. Chart is provided for illustrative purposes.
Exhibit 6. Constituent Returns for S&P Europe 350 Members Are Highly Skewed
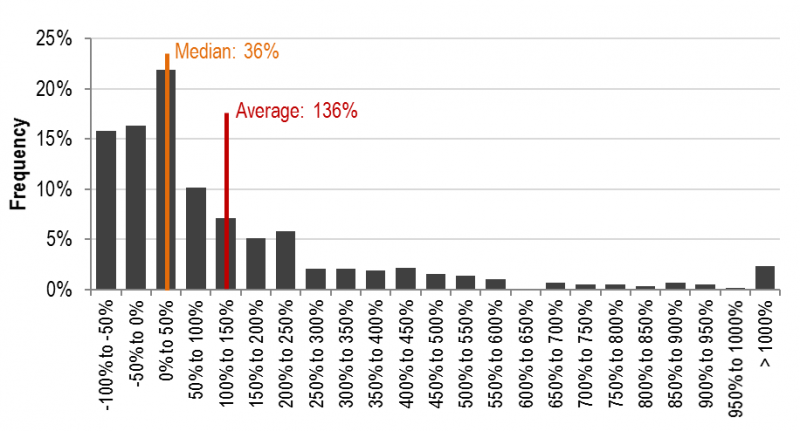
Source: S&P Dow Jones Indices LLC, Factset. Data from Dec. 31, 2000 to Dec. 31, 2019. Past performance is no guarantee of future results. Chart is provided for illustrative purposes.
Notice that we have not mentioned the notion of “market efficiency.” Eugene Fama coined the term “efficient market” in 1965, defining it as “a market in which prices always ‘fully reflect’ available information.”17 Obviously, if markets fully reflect available information, market prices will reflect true value, which makes security selection pointless. The challenge for advocates of the efficient markets hypothesis is that it’s quite easy to find ex post evidence of times when value and price did not correspond – for example, during the technology bubble of the late 1990s.
But the assumption of efficiency is not necessary to make the case for index funds. Even if we acknowledge that prices may not always reflect fair value, the factors we’ve identified – professionalization, cost, and skewness – will challenge active managers relentlessly.
The chronic failure of active management, in other words, is not a coincidence. It occurs for good, robust, persistent reasons. The superior performance of indexing, and the flow of assets away from active managers, are therefore likely to continue.
Samuelson, Paul A., “Challenge to judgment,” Journal of Portfolio Management, Fall 1974. Interestingly, John Bogle credits this article with inspiring him to start the first index mutual fund at Vanguard in 1976.
Bogle, John C., “The Professor, the Student, and the Index Fund,” Sept. 6, 2011.
Samuelson may have been primus inter pares but he was not alone. Other important contemporary influences include Burton G. Malkiel’s book A Random Walk Down Wall Street (first edition 1973) and an important article by Charles D. Ellis, “The Loser’s Game,” Financial Analysts Journal, July/August 1975. Antiquarians might be interested to know that the earliest study of active management of which we’re aware dates to the 1930s (Alfred Cowles 3rd, “Can Stock Market Forecasters Forecast?”, Econometrica, July 1933). Across the decades, the conclusions have been consistent.
Liu, Berlinda, “SPIVA U.S. Year-End 2019,” S&P Dow Jones Indices, April 2020.
Innes, Andrew, “SPIVA Europe Year-End 2019,” S&P Dow Jones Indices, March 2020.
Samuelson, op. cit., p. 19.
Liu, Berlinda, “U.S. Persistence Scorecard Year-End 2019,” S&P Dow Jones Indices, June 2020.
Interestingly, if we ask about the persistence of outperformance versus the benchmark (as opposed to the persistence of ranking versus other managers), the results are equally discouraging. See Liu, Berlinda and Andrew Cairns, “Fleeting Alpha: The Challenge of Consistent Outperformance,” S&P Dow Jones Indices, Feb. 2020.
Mauboussin, Michael J. and Dan Callahan, “Alpha and the Paradox of Skill,” Credit Suisse, July 15, 2013, p. 7.
Ellis (1975), op. cit., p.19. For a particularly colorful description of the investment business before its professionalization (“…we had idiot competition when we were young”), see Zweig, Jason and Nicole Friedman, “Charlie Munger, Unplugged,” Wall Street Journal, May 3, 2019.
See Pastor, Lubos, Robert F. Stambaugh, and Lucian A. Taylor, “Scale and Skill in Active Management,” National Bureau of Economic Research, February 2014.
Arbit, Hal, “The Nature of the Game,” Journal of Portfolio Management,” Fall 1981, pp. 5-9.
A crude analogy of which I’m very fond: The lion catches the slowest zebra in the herd, after which the speed of the average herd member goes up. It will be more challenging to stay ahead of tomorrow’s lion. Mutatis mutandis, the same principle applies to active managers.
Sharpe, William F., “The Arithmetic of Active Management,” Financial Analysts Journal,” January/February 1991, pp. 7-9.
Investment Company Institute, 2020 Investment Company Fact Book, May 2020.
We find similar results in other markets. The average stock outperformed the median in 17 of the last 22 years for the S&P/TSX Composite, 12 of 19 years for the S&P Europe 350, 23 of 24 years for the S&P/TOPIX 150, 11 of 19 years for the S&P/ASX 200, and 23 of 23 years for the S&P Pan Asia ex-Japan BMI. For a really long term (90 year!) perspective, see Bessembinder, Hendrik, “Do Stocks Outperform Treasury Bills?,” November 2017.
Fama, Eugene F., “The Behavior of Stock Market Prices,” Journal of Business, Jan. 1965, pp. 34-105.