Contrary to predictions that demand for cash will decline with the increased availability and use of non-cash payment means, currency demand has increased in the euro area and the U.S.A. over the past 15 years. In this context, this short article summarizes recent findings from Jobst and Stix (2017), broadening the scope both along the spatial and the time dimensions. Data on currency circulation from 2001 until 2014 for a sample of 70 economies reveals that the recent increase in circulation is not confined to international currencies like the U.S. dollar or the euro but can be observed in very different economies. Investigating evidence for the United States and Germany for the past 140 years shows that the recent increase is sizeable and compares to a similar upsurge in the wake of the 1930s financial crisis. Finally, in economies where currency demand increased, the increase typically took place after the start of the economic and financial crisis of 2007/08. Panel money demand models show that conventional economic factors like low interest rates can account for some part of the increase but leave a notable part unexplained, in particular in rich economies. While hard evidence is difficult to come by, we conjecture that cash demand was driven by the higher level of economic uncertainty pertaining since the financial crisis of 2008, which resulted in hoarding.
1. Introduction
If we were to believe technology cheerleaders (c.f. BBC, 2015), cash is about to disappear. It has already almost done so in Sweden and it will do so everywhere else rather soon. Thanks to internet, mobile phones and NFC the use of cashless payment technologies in industrialized economies, which has already been progressing over the past decades (Amromin and Chakravorti 2009; Bagnall et al. 2014), is about to enter a fundamentally new phase.
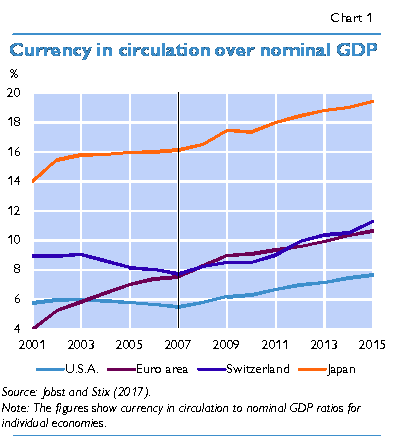
This story however does not match up with the empirical evidence. People (still) hold enormous amounts of physical cash: In 2014, per capita holdings were around USD 4,000 in the euro area and the U.S.A. What is even more puzzling, in recent years cash circulation has gone up sizably in the euro area, the U.S.A., Switzerland and Japan, notably after 2007 (chart 1).
Both the magnitude of cash circulation and its increase over the past decade(s) raise crucial questions for central banks and economic policy makers alike: What explains the puzzling size of cash circulation? Can the extent and the increase over time be explained by conventional economic forces, e.g. lower interest rates, or are there alternative explanations? What does the apparent demand for cash imply for plans to phase out or at least restrict the use of cash as recently proposed by several economists? In this short paper we summarize results of Jobst and Stix (2017). To assess and to understand recent trends, we suggest to analyze currency demand from a broader perspective by going beyond the literature’s typically rather narrow focus on either relatively short time periods (e.g. the post-World War II period) or on relatively few economies (e.g. the U.S.A., the euro area, etc.). We extend the investigation back to the late 19th century for the United States and Germany. This perspective shows that the recent increase is sizeable and compares to a similar upsurge in the wake of the financial crisis of the 1930s. Second, we collected data on currency circulation from 2001 until 2014 for a sample of 70 economies. This perspective underscores that the recent increase is broad-based and can be observed in very different economies. The panel setting also allows us to econometrically study the recent drivers of cash demand. We show that conventional economic factors like low interest rates can account for some part of the increase but leave a notable part unexplained. While hard evidence is difficult to come by, our results support the conjecture that cash demand was driven by a higher level of economic uncertainty pertaining since the financial crisis of 2008.
2. Stylized facts on the recent upsurge in cash demand
Developments in the circulation of the U.S. dollar and the euro are unrepresentative for the circulation of cash at large. A significant part of U.S. dollars and euros circulates outside their monetary area, which explains part of the high per capita holdings of these two currencies (Bartzsch, Ro sl and Seitz, 2013; Judson, 2017; Assenmacher, Seitz and Tenhofen, 2017 for Switzerland). Potentially, the recent upsurge in the circulation of U.S. dollar and euro could also have been due to international demand. To separate out domestic and international factors we have to enlarge our sample. Specifically, Jobst and Stix (2017) have collected data from around 70 economies for the period from 2001 to 2014. In essence, the sample covers the richest economies in terms of their absolute economic size plus regionally important economies that were added for breadth of geographical coverage. Overall, all included economies account for about 96% of World GDP in each year from 2001 to 2014. Henceforth, this sample will be denoted as the “World”.2
Four stylized facts emerge:
1. Currency ratios diverge widely, but even in low-cash economies cash holdings per capita are difficult to reconcile with transaction demand
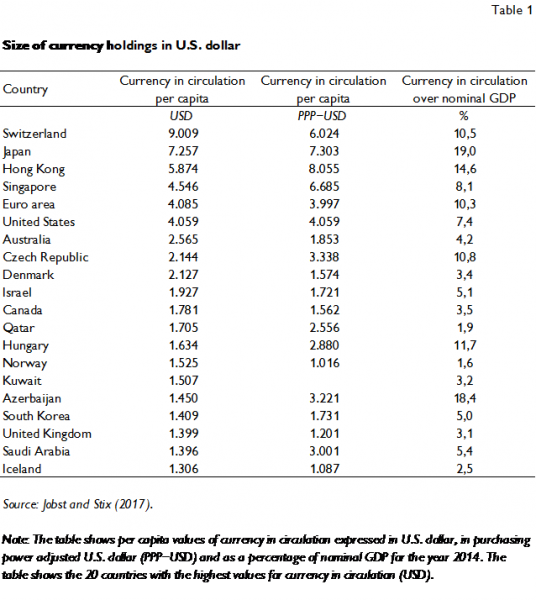
Per capita circulation fluctuates enormously ranging from about USD 30 to 70 in African economies like Kenya, Tanzania, Uganda, Nigeria or Cameroon to USD 9,000 in Switzerland. Table 1 lists the 20 economies with the highest per capita values of currency in circulation both using market exchange rates (USD) and purchasing power adjusted exchange rates (PPP-USD). The euro area and the U.S.A. had a per capita circulation of around USD 4,000. This compares with values of USD 1,250 in Sweden and USD 1,520 in Norway, which are the countries considered as frontrunners in electronic payments. But even in these countries, per capita holdings are still very high and much higher than can be explained by transaction motives. Table 1 thus substantiates that international circulation alone cannot explain high per-capita holdings in some economies. Rather, cash must be hoarded in many economies and/or serve other purposes than pure transaction needs.
2. Aggregate currency circulation at the world-level has increased
A related question raised by the recent increases in the circulation of U.S. dollar and euro is whether this phenomenon is restricted to international currencies or more broad-based. The left panel of chart 2 depicts the currency in circulation (CiC) over nominal GDP ratio for the aggregate of all economies in our “World” sample. The ratio slopes upward throughout the period and a discernible level shift can be observed between 2007 and 2009. Part of the observed increase of the CiC over the nominal GDP ratio is the result of a declining GDP in the course of the global financial crisis. The right panel of chart 2 depicts the indexed temporal evolution of nominal CiC and nominal GDP. Nominal GDP remained roughly constant from 2008 to 2009 but increased afterwards. At the same time, nominal CiC increased from 2008 to 2009. Therefore, the ratio of these two variables increased from 2008 to 2009. However, in addition to this one-time level shift, the gap between CiC and nominal GDP was growing throughout the entire observation period. Given the presumed shift to non-cash payments, this increase needs to be explained.
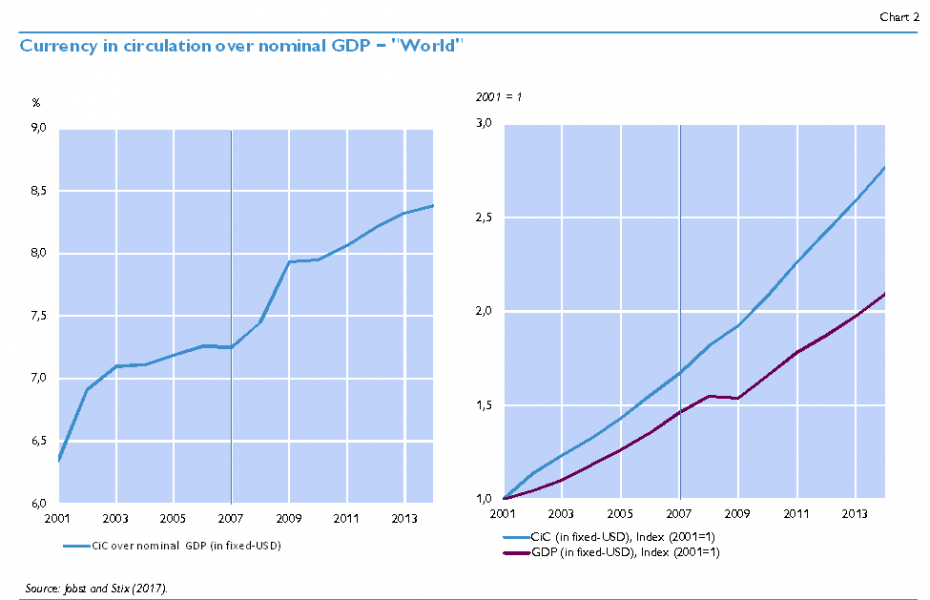
Note: The figures show the currency in circulation to nominal GDP ratios (left panel) as well as the evolution of currency in circulation and nominal GDP (right panel). All figures refer to the “World” as specified in Jobst and Stix (2017). The aggregation is based on market USD exchange rates that are fixed at 2006. Sources and methods are described in Jobst and Stix (2017).
3. The increase in currency circulation can be observed for international and non-international currencies as well as for OECD- and non-OECD economies
Chart 3 contrasts the development in the main economies that face overseas demand, United States (US), euro area (EA) and Switzerland (CH) with the development in the remaining economies. Among the remaining economies, three sub-aggregates are shown: (i) dollarized economies, (ii) non-dollarized economies that are not members of the OECD and (iii) non-dollarized economies that are OECD members. In the latter aggregate Japan has been excluded because of its large weight within this group.
The comparison shows that the increase in the CiC to GDP ratio is not confined to the international currencies – although the increase has been stronger for the euro, the U.S. dollar and the Swiss franc. In non-dollarized non-OECD member economies, there is an increase from 2008 to 2009 and a constant ratio afterwards. Among non-dollarized OECD member, the increase around 2008 is smaller but the positive trend has continued until 2014. The only exception to the general trend is provided by the dollarized economies. Here the currency ratio increased until 2007 but declined afterwards. We conjecture that this increase is due to the benign economic conditions associated with the “great moderation”, i.e., low interest rates and increasing levels of trust in national currencies resulting in a reduction of currency substitution. From 2007 onwards, the trend apparently reverted as the ratio was first declining and then relatively constant.
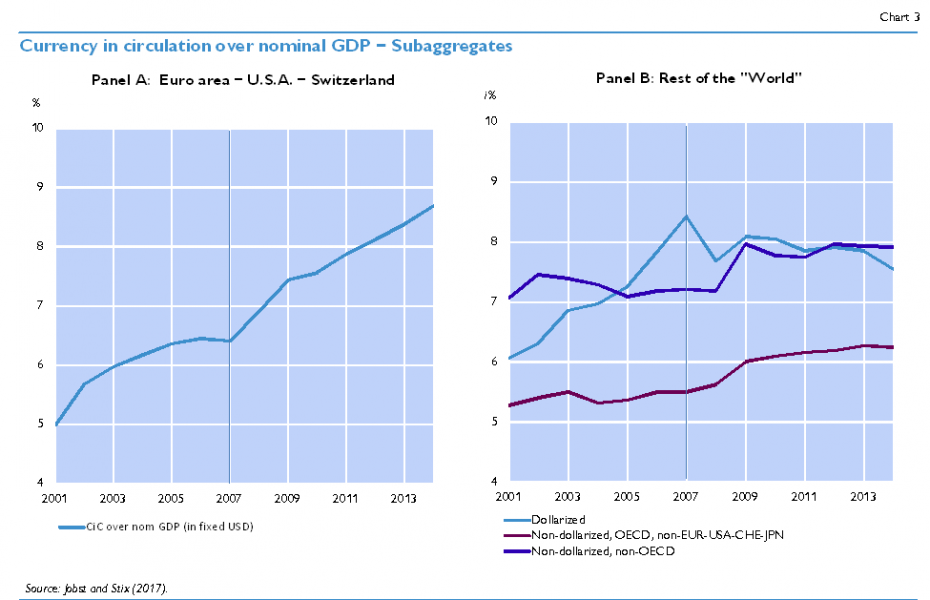
Note: The figures show currency in circulation to nominal GDP for various aggregates of economies. Panel A refers to the aggregate of the euro area, the U.S.A. and Switzerland. Panel B refers to (i) dollarized economies, (ii) non-dollarized non-OECD economies and to (iii) non-dollarized OECD economies excluding EUR, the USD, CHF and JPN. The yen was excluded because of its high weight in this aggregate. All aggregations are based on market USD exchange rates that are fixed at 2006. Sources and methods are described in Jobst and Stix (2017).
4. Also within country groups the increase in circulation is broad-based
Last, the increase in aggregate circulation figures is not due to a handful of large economies but is broad-based. Chart 4 provides a summary of the temporal development of currency in circulation to nominal GDP ratios for individual economies. Specifically, we focus on the change in the ratios from 2004/05 to 2013/14 and show the relative proportion of economies in which the ratio increased by more than +10% as well as the proportion of economies in which the ratio decreased by more than -10%. In the sample of all economies (“World”), the unweighted mean (median) change is 17% (13%). One quarter of economies faced an increase by more than 37%. Chart 4 shows that the share of economies with an increase (blue bar) is higher than the share of economies with a decrease (purple bar). This holds for the “World”, for dollarized and for non-dollarized economies (the latter group is further separated in OECD and non-OECD members).
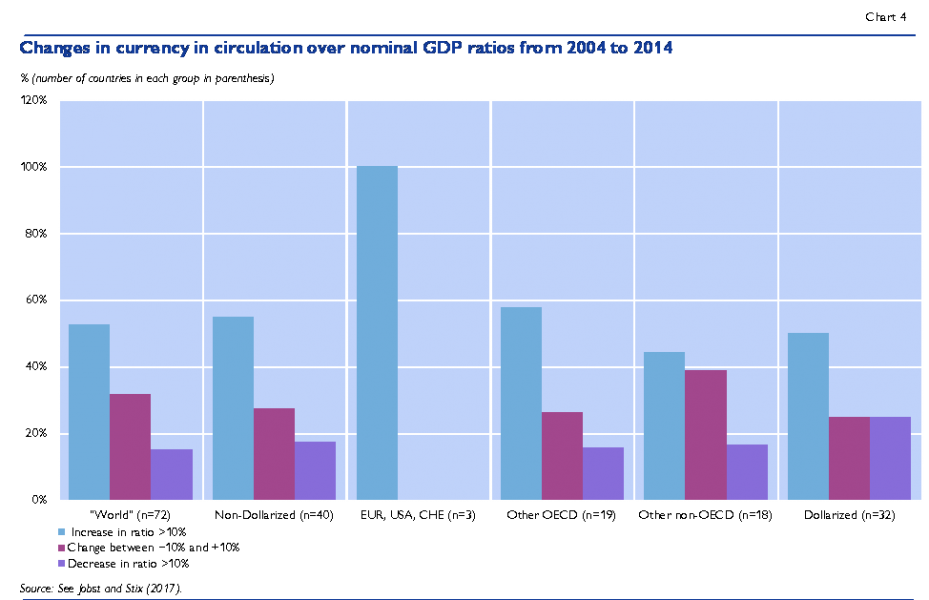
Note: The chart shows descriptive statistics about changes in the currency in circulation over nominal GDP ratios over the period from 2004/05 to 2013/14 for the “World” and several sub-aggregates. The group size is indicated in parenthesis. Averages are taken for 2004/05 and 2013/14 to reduce the effect of outliers.
Overall, the descriptive account shows (i) that cash demand has increased in the “World” as a whole, (ii) that cash demand has increased not only in the euro area and the U.S.A. but in the majority of economies from 2003 to 2014 and (iii) that the increases cannot be assigned to only poorer or richer economies.
3. How does the recent upsurge compare historically?
In order to assess the significance of recent increases it is useful to put them into a long-run perspective. Chart 5 displays the ratio of currency in circulation over nominal GDP from the last quarter of the 19th century to 2015 for the United States (US), Germany (DE) and the euro area (EA) 3 . In the following, we focus on the most important long-run trends.
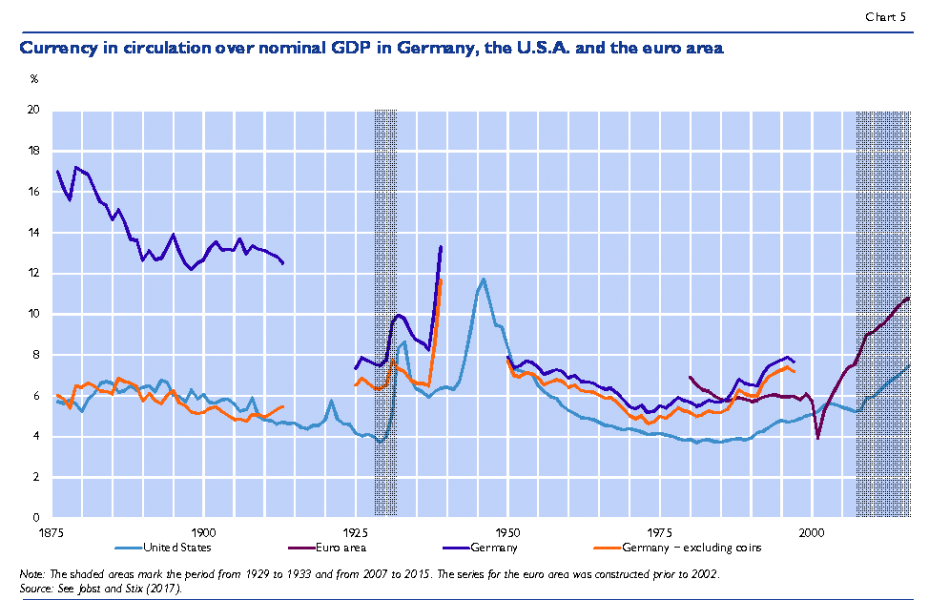
The following main observations can be taken from chart 5:
1) Comparing the values of 1990 with those from around 1890 informs us that cash use has declined: from 13% to 6% in Germany and from 6% to 4% in the U.S.A.
2) However, the decline in currency demand is not uniform. World War II marks the strongest reversal in the secular downward trend; other events are World War I and the Great Depression.
3) Over the post-World War II period, there is a secular decline in currency demand. This is the time frame that is usually analyzed in studies on the use of currency. It is evident that the focus on only the post-World War II period biases the picture as CiC levels were exceptionally high after the war. There is large agreement as to the causes of the decline after World War II: increase in the dissemination of transaction accounts, the non-cash payment of wages, the increased use of payment cards and cheques and the dissemination of ATMs which allowed consumers to economize on cash balances (e.g. Krüger 2016).
4) Since the mid-1980s, the long-run trend decline has come to a halt or even reverted: CiC has increased in the U.S.A. and in Germany. The increase in CiC after the mid-1980s fits well to political/economic events (e.g. the breakdown of Communism, developments in Latin American economies) which fueled international demand for U.S. dollar and Deutsche mark (Porter and Judson 1996, Seitz 1997).
5) Since 2007, CiC over nominal GDP has increased further in the U.S.A. and the euro area. The recent increases are large even if seen over a 150-year horizon. With the exception of World War II, there is only one episode with a comparable increase: the Great Depression, even though back then the increase was considerably steeper and more sudden than after 2007/08.
4. Reasons for recent increases in currency demand
There are four plausible arguments that could rationalize the increase in cash demand. First, after 2007/08 interest rates decreased in the majority of economies and reached near-zero levels in some economies. Second, some authors have argued that increases in shadow economic activities, tax evasion and/or higher shares of self-employed could be drivers of higher cash demand (Goodhart and Ashworth, 2014). Third, the increases could be a consequence of portfolio shifts either due to lower confidence in banks or due to increased uncertainty. This interpretation focuses on the asset (safe haven) role of cash. Note that this interpretation does not necessarily rely on the occurrence of banking panics as in the 1930s. Goodhart and Ashworth 2015 and 2017, for example, exclude banking panics as a driver of cash increases in some major economies. Fourth, Friedman and Schwartz (1963) argue that velocity tends to decrease in contractions because agents’ demand for cash is based on permanent income rather than period income. In this line of argument, cash holdings could be higher relative to GDP if agents have not adjusted their pre-crisis estimate of permanent income to the lower income growth that occurred after 2008.
In order to analyze the relative importance of these factors Jobst and Stix (2017) estimate a panel money demand model where (log) real per capita cash holdings is related to (log) real per capita GDP, deposit interest rates and a measure of shadow economic activities. 4 In addition time dummy variables for the years after 2008 are emloyed to measure whether any shift can be observed after 2008 that cannot be assigned to the other independent variables. The panel estimation is based on a fixed effects model such that the focus of the analysis is on changes over time (with different levels in cash demand across economies being controlled for). Also, it is important to note that point estimates reflect an average effect across economies, not accounting for their relative size.
Given the difficulties in isolating the foreign demand component we omit the U.S.A., euro area, Switzerland, Singapore and Hong Kong from our sample such that all estimated effects primarily refer to domestic demand. Similarly, the estimations focus on non-dollarized economies only. The main results can be summarized as follows:
1) In general, estimated income and interest rate elasticities are within plausible ranges as found previously in the literature. This is reassuring as the economies that are included in the estimation differ substantially by their economic and financial development. 5 For example, the income elasticity, which is allowed to vary across economies, is on average below one in higher GDP economies which suggest that there are economies of scale in the use of cash.
2) Interest rates are found to exert a significant negative impact on cash demand. Given the changes in interest rates after 2008, Jobst and Stix (2017) conduct various specifications to check for the robustness and to analyze whether the elasticity of cash demand changes as interest rates become very low (log-log, semi-log, different slopes after 2008, different parameters for interest rates below and above 1%). The findings suggest a saturation level of cash that agents are willing to hold even if interest rates are (very) close to zero. In general, this result implies that part of the increase in cash demand can be attributed to lower interest rates.
3) The use of (an incomplete proxy for) permanent income instead of period income as a scale variable renders the unexplained shift smaller but does not eliminate it.
4) No significant effect is found for the shadow economy indicator, suggesting that changes in shadow economic activities exerted no impact on changes in cash demand during the period under study. The reason for this finding is that the shadow economic indicator is declining in many economies over the sample period, while demand for cash is increasing. 6 As results represent an average effect across economies this does not mean that changes in shadow economic activities might not have been of importance for cash demand in some economies as, for example, stated in Goodhart and Ashworth (2015). Moreover, it should be made clear that we focus on changes in cash demand and not on level differences across economies and that we just use one indicator of shadow economic activities.
The key question is whether the temporal evolution of GDP and interest rates can account for the observed increases in cash circulation. We find that results differ depending on the characteristics of the economies. For economies with below median GDP per capita, all of the changes (increases) can be explained by these conventional economic forces. However, for economies with above median GDP the time dummy variables that are included in the regressions indicate an upward shift after 2009 that cannot be explained by GDP or interest rates.
A natural next extension would be to include measures of trust in banks or perceived uncertainty and to study whether these variables account for the unexplained level shift. As such data are unavailable for the full sample, we conduct an indirect test by splitting the sample into groups of economies that (i) did not experience any systemic banking crisis in the post World War II period, (ii) experienced a systemic banking crisis in 2007/08 (but not before) or had (iii) experienced a systemic banking crisis before 2007/08 (but not in 2007/08). 7 The idea for the inclusion of the latter group is that memories of a crisis can have a persistent impact on financial behavior of individuals (Malmendier and Nagel, 2011; Osili and Paulson, 2014; Stix, 2013) even if no crisis occurred in the specific economy in 2007/08. We then estimated the currency demand model for the first and third group and tested whether the time dummy variables remain significant. The approach suffers from relatively small group sizes. Moreover, there might be unobserved variables which affect cash demand that are correlated with the groups. Therefore, results are indicative only and cannot be interpreted as causal.
Yet, the estimation results are in line with expectations. In the group of economies without a systemic banking crisis no unexplained level shift is found. In the group of economies with
a banking crisis before 2007/08 (but not in 2007/08) a significant level shift is found. 8 For the group with a financial crisis in 2007/08 (but not before), we could not estimate a model because of a small number of economies. On a descriptive scale, we note that three out of four economies had sizeable increases in cash demand after 2007/08. Overall, these results suggest that banking crises have had an impact on post-2007 cash demand.
5. Conclusions
The paper summarizes results from Jobst and Stix (2017) and provides some additional descriptive evidence. Findings show that cash demand has increased not only in the euro area and the U.S.A. but also in many other economies over the past decade.
The results from panel estimations for non-dollarized economies and for currencies that are not circulating internationally indicate that lower interest rates and the evolution of income explain parts of the increase. However, in economies with a higher GDP, the increases after 2009 cannot fully be accounted for by these conventional economic forces. The increase in the use of cash cannot be explained by an increase in shadow economic activities either. Interestingly, the unexplained increase in cash demand can be mainly observed for the relatively rich economies – whereas one would expect a decline in these economies due to the proliferation of cashless payments (Bagnall et al., 2016). This result suggests that overall currency in circulation is dominated by hoarding and other motives rather than by transaction motives.
What are the drivers for the unexplained increase in cash demand? While many factors other than income and interest rates could be important for the increase in cash demand, empirical analysis is limited by the lack of good empirical measures. Therefore, any explanation of the unexplained increase in cash demand in higher GDP economies necessarily has to remain speculative. We conjecture that the financial crisis of 2007/08 and the subsequent turbulences in some economies have lowered confidence in banks and/or increased uncertainty, notably also in economies without a financial crisis. It is well possible that the increase in uncertainty, in combination with very low interest rates and thus low opportunity costs of holding cash, is an important additional reason for the increase in cash demand in many richer economies after 2009. In order to explain the observed pattern in cash demand, however, the argument requires a rather persistent increase in uncertainty/decrease in confidence and not just a short-term shock in 2008/09. Evidence from news-based indices (Baker et al., 2016) indicate that economic policy uncertainty increased substantially in 2008 and remained at elevated levels, at least in Europe.
To conclude, Friedman’s and Schwartz’ (1963) emphasis on the key importance of sentiment seems to be alive and well: “The more uncertain the future, the greater the value of [the] flexibility [of cash] and hence the greater the demand for money is likely to be” (p. 673). That we still know so little about the underlying reasons of the recent increases in currency demand, highlights that there is a dire need for more data and more research to better understand the people’s use of cash in calm times and in times of crisis/uncertainty. Without a better understanding of this development, it does not seem to be a good idea to phase out physical currency and to replace it by electronic means of payments as has been advocated by some scholars (e.g. Rogoff, 2016).
Amromin, G. and S. Chakravorti. 2009. Whither Loose Change? The Diminishing Demand for Small-Denomination Currency. In: Journal of Money, Credit and Banking 41(2-3). 315–335.
Assenmacher, K., F. Seitz and J. Tenhofen. 2017. The use of large denomination banknotes in Switzerland. Paper presented at the 3rd International Cash Conference. Deutsche Bundesbank. April.
Bagnall, J., D. Bounie, A. Kosse, K. P. Huynh, T. Schmidt, S. Schuh and H. Stix. 2016. Consumer Cash Usage and Management: A Cross-Country Comparison with Diary Survey Data. In: International Journal of Central Banking 12(4). 1–61.
Baker, S. R., N. Bloom and St. J. Davis. 2016. Measuring Economic Policy Uncertainty. http://www.policyuncertainty.com/media/EPU_BBD_Mar2016.pdf.
Bartzsch, N., G. Rösl and F. Seitz. 2013. Currency movements within and outside a currency union: The case of Germany and the euro area. In: The Quarterly Review of Economics and Finance 53. 393–401.
BBC. 2015. The truth about the death of cash. http://www.bbc.com/future/story/20150724-the-truth-about-the-death-of-cash.
Goodhart, C. A. E. and J. Ashworth. 2014. Trying to Glimpse the “Grey Economy”. VOX – CEPR’s Policy Portal. http://voxeu.org/article/trying-glimpse-grey-economy.
Goodhart, C. A. E. and J. Ashworth. 2015. Measuring Public Panic in the Great Financial Crisis. VOX – CEPR’s Policy Portal. http://voxeu.org/article/measuring-public-panic-great-financial-crisis.
Goodhart, C. A. E. and J. Ashworth. 2017. The Surprising Recovery of Currency Usage. Paper presented at the 3rd International Cash Conference. Deutsche Bundesbank. April.
Google Trends. 2017. http://trends.google.at/trends.
Friedman, M. and A. J. Schwartz. 1963. A Monetary History of the United States, 1867–1960. Princeton: Princeton University Press for NBER.
Jobst, C. and H. Stix. 2017. Doomed to Disappear: The Surprising Return of Cash Across Time and Across Countries. Mimeo.
Judson, R. 2017. The Death of Cash? Not So Fast: Demand for U.S. Currency at Home and Abroad, 1990–2016. Paper presented at the 3rd International Cash Conference, Deutsche Bundesbank. April.
Krüger, M. 2016. The Spread of Branch Banking and the Demand for Cash in Post-War Germany. ROME Discussion Paper Series No. 16-09. October.
Laeven, L. and F. Valencia. 2012. Systemic Banking Crises Database: An update. IMF Working Papers No. 12/163.
Malmendier, U. and S. Nagel. 2011. Depression Babies: Do Macroeconomic Experiences Affect Risk Taking? In: The Quarterly Journal of Economics 126. 373–416.
Osili, U.O. and A. Paulson. 2014. Crises and Confidence: Systemic Banking Crises and Depositor Behavior. In: Journal of Financial Economics 111. 646–660.
Porter, R. D. and R. A. Judson. 1996. The Location of U.S. Currency: How Much Is Abroad? Federal Reserve Bulletin 82. October. 883–903.
Rogoff, K. S. 2016. The Curse of Cash. Princeton and Oxford: Princeton University Press.
Schneider, F. 2017. Unpublished data. Source: Professor Dr. Friedrich Schneider, Department of Economics. University of Linz. Austria.
Seitz, F. 1997. How Many Deutschmarks are Held Abroad? In: Intereconomics 32(2). March/April. 67–73.
Stix, H. 2013. Why do People Save in Cash? Distrust, Memories of Banking Crises, Weak Institutions and Dollarization. In: Journal of Banking & Finance 37. 4087–4106.
clemens.jobst@oenb.at, Economic Analysis Division. helmut.stix@oenb.at, Economic Studies Division.
The views expressed in this paper are exclusively those of the authors and do not necessarily reflect those of the Oesterreichische Nationalbank or the Eurosystem. We thank Professor Schneider (University of Linz) for sharing the shadow economic indicators and Tobias Himmelbauer for excellent research assistance.
Aggregating economies raises the issue of which exchange rate has to be applied. In this paper, all results which refer to aggregations are based on USD exchange rates that are fixed as of 2006. This eliminates the impact of exchange rate movements that have occurred in the course of the economic and financial crisis. Jobst and Stix (2017) provide results on aggregations based on other exchange rates and find that results are largely unaffected, qualitatively.
Historically, in some countries a significant part of cash circulation consisted of specie coins. These are also included here in addition to banknotes. On the construction of the series see Jobst and Stix (2017). The euro series for the period from 1980 to 2001 reflects a synthetic aggregate of the future euro area members.
This measure is based on Schneider (2017) and does not employ cash as an input in its computation.
A few economies with very implausible point estimates for the income (scale) elasticity were omitted from the sample.
For example, it declined in 30 out of 32 OECD economies from 2003 to 2014. Although cash demand estimations omit the euro area it should be noted that an increase of shadow economic activities is only found in Cyprus, Spain and Portugal. In the U.S.A, U.K. and Japan there is a slight decrease.
The separation of economies into these groups is based on Laeven and Valencia (2012).
With regard to the effect of the financial crisis of 2007/08, results depend on the functional form of money demand (log-log or semi-log) and are not unambiguous.